Graphics Programs Reference
In-Depth Information
Here the small solid circle corresponds to
λ
T
=
1
/
2, and we are just at the
limit of stability, since this circle does not cross the spiral produced by
z
exp(
z
) for
z
a complex number on the critical line Re
z
=
0, though it “hugs”
the spiral closely. The dotted and dashed circles, corresponding to
λ
T
=
1or
2, do cross the spiral, so they correspond to unstable traffic flow.
We can check these theoretical predictions with a simulation using
SIMULINK. We'll give a picture of the SIMULINK model and then
explain it.
5
5
.8
In1 Out1
5
5
sensitivity
parameter
5
Reaction-time
Delay
Subsystem:
computes velocity
differences
car speeds
1
s
5
5
5
x
o
Integrate
u" to get u'
-C-
1
s
5
5
5
x
o
Integrate
u' to get u
5
initial velocities
5
relative
car positions
5
5
Ramp
carpositions
5
5
-C-
To Workspace
initial car positions
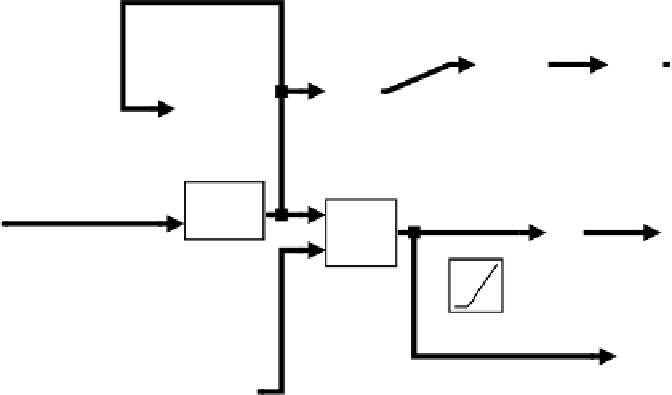
Here the subsystem, which corresponds to multiplication by
S
−
I
, looks like
this:
5
1
Out1
5
4
5
5
5
1
In1
em
5
4
Here are some words of explanation. First, we are showing the model using
the options
Wide nonscalar lines
and
Signal dimensions
in the
Format


Search WWH ::

Custom Search