Database Reference
In-Depth Information
CTC
C4.5
union
100,00
100,00
90,00
90,00
80,00
80,00
70,00
70,00
60,00
60,00
50,00
50,00
40,00
40,00
30,00
30,00
5
10
20
30
40
50
5
10
20
30
40
50
Number_Samples
Number_Samples
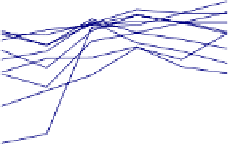
Fig. 2.
Structural convergence of CTC and C4.5
union
for the
Breast-W
domain
can be observed that the CTs have in average 90% or more of the structure common
in 6 folds out of 10; and in the fold with worst results the compared trees have 50%
of the structure equal. As the number of samples used to build the CTs increases,
the percentage of the trees that is equal increases in most of the folds. Concretely,
when the number of samples used is 40 or greater, all the trees in the 10 folds are
identical. We can say in this case that the CT trees converge structurally in
N_S
=
40. This means that for
N_S
= 40 or greater, the tree built with CTC will be always
the same independently of the used subsamples. For C4.5
union
trees (right side), we
can not observe any convergence when increasing the number of samples used to
build them.
After this analysis we could say that Fig. 2 shows the structural convergence of
CTC algorithm in
Breast-W
domain (There is not convergence for C4.5
union
).
As a summary, we can say that for
Breast-W
database, CTs converge to an unique
tree after a certain value of
Number_Samples
, whereas C4.5 trees show a greater
structural variation.
If we analyse the results of the 20 databases (see Table 3 where averages of the 5
runs and 10 folds for %
Common
are presented), for most of them (15 databases for
N_S
= 50, and similar values for the rest) CT trees have larger common structure than
C4.5 trees, that is to say, the behaviour of CTC is better than the behaviour of
C4.5
union
, For some values of
Number_Samples
parameter, relative improvements up
to 50% are achieved.
After studying the results in Fig. 2 and Table 3, it seems that from a certain value
of
Number_Samples
parameter the tree obtained with CTC algorithm will be always
the same.
In the previous analysis all the comparisons have been done among trees with the
same value of
Number_Samples
parameter and we have observed that the value of
%Common
increases with this parameter. This suggests us a new question: will also
the structure of CTs built with different values of
Number_Samples
be similar? In this
case, we could say that CT trees are gradually changing towards a specific tree while
Number_Samples
increases. To answer this question we present the study of Fig. 3.
Fig. 3 shows the values
%Common
for CTC (continuos lines), C4.5
union
(dashed
lines) and C4.5
100
(triangles,
Number_Samples
parameter does not make any sense in
this case), so that, for each case an idea of the percentage of the tree that remains
common is given.


Search WWH ::

Custom Search