Database Reference
In-Depth Information
(a)
(b)
(c)
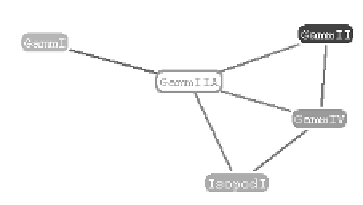
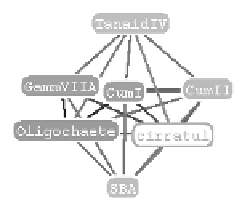
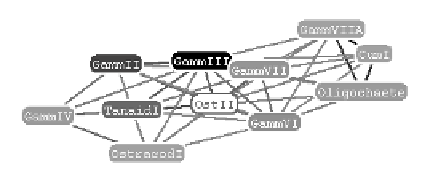
Fig. 3.
Three different views of the species graph shown in Fig. 2b, each showing only
the immediate neighbours of the focus node. (a) and (b) are focused on
GammIIA
and
cirratul
, species from the periphery of the original graph, while (c) is focused on
the more central
OstII
. The white node is the “focus node” (see text); other colours
indicate the number of sites at which a particular species was observed, ranging from
grey (low) to black (high).
GammIIA
and
cirratul
have fewer neighbours and were
seen at fewer sites than
OstII
, indicating that
OstII
is less specialised in its preferred
environment than
GammIIA
and
cirratul
.
environmental conditions. A similar argument applies to
cirratul
(Fig. 3b). How-
ever, those species that are more central in the graph (e.g.
OstII
) are connected
to many other species and were seen at many sites and are therefore less spe-
cialised in terms of their preferred environment.
Having established some patterns in species assemblages, we wish to explore
the relationships between these patterns and measured metal contamination.
A convenient method for this is through the graph similarity operator. We
generated a second graph of sites, using chromium as attribute data (graph
not shown), and made an edge-wise weight comparison between the site-species
graph and the site-chromium graph. The result is shown in Fig. 4. The struc-
ture of this graph is identical to that in Fig. 1, but the colouring of the edges
indicates the weight similarity. Darker grey indicates edges that have similar
weights in both the site-species and site-chromium graphs. Edges within the
O'Brien Bay and Brown Bay clusters are generally well explained by chromium
(i.e. similar within-cluster chromium values). More notably, the edges linking
the O'Brien Bay cluster to the Brown Bay cluster are not well explained in
terms of chromium. Similar results were obtained using the other metal variables,


Search WWH ::

Custom Search