Geology Reference
In-Depth Information
forces applied during strength tests have been routinely
observed, as described and explained below.
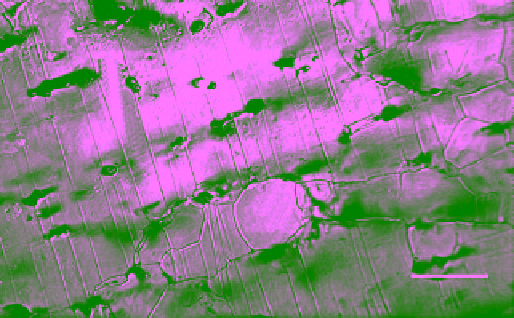
Figure 2.30 is a photomicrograph of a thermally etched
horizontal section of columnar‐grained, S3‐type, FY sea
ice in a specimen that was subjected to low strain rate
mechanical loading during biaxial compression tests.
This micrograph exemplifies an area practically inside
one grain in which rows of brine pockets were trapped in
basal planes. The
c
axis, normal to the basal planes, is
indicated by <
c
>. Here, the brine and air inclusions
appear as darker objects. The layers of these inclusions
can be seen as rows parallel to the basal planes, but they
are not necessarily in straight lines, like marching soldiers.
This can be visualized from the schematics presented ear-
lier in Figures 2.24 and 2.25. Signs of stress (strain) con-
centrations surrounding these inclusions are revealed by
the short straight lines. These lines (cross section of
planes) are actually grooved in the planes and made visi-
ble as protruding up, with a three‐dimensional effect, by a
special arrangement of the source of light of the optical
microscope. It can be seen that the lines are parallel to the
c
axis of the grain, an indication that they correspond to
“small‐angle tilt boundaries,” a term used in metallurgy
for segments of small mismatch of the
c
axis on the two
sides of the lines in case of the hexagonal lattice. In simple
words, tilt boundaries form when a crystal is subjected to
bending moments and the dislocations move to accom-
modate the strain, a process commonly known as recov-
ery. Tilt boundaries can be recognized by the fact that
they are straight segments, not curved, and parallel to
the
c
axis. Dislocations in the basal planes can easily
move (called slip) along the basal planes in ice. They can
also leave the basal plane and climb to the next plane.
This climbing mechanism is strictly a high‐temperature
phenomenon and can be monitored during their climbing
motions as shown by
Sinha
[1987b]. Slipping basal dislo-
cations can be blocked by internal obstacles. One of the
most common obstacles is the grain boundaries. Pileup of
dislocations also appear as straight segments on thermal
etching, but since they are produced by slipping disloca-
tions in the basal planes, the etched lines are at right angle
to the
c
axis [
Sinha,
1978a]. Major segments of subgrain
boundaries in sea ice also correspond to the lattice mis-
match or the angular difference in the orientations of the
c
axis of the neighboring subcrystals. They are simply
called “low‐angle boundaries.”
Figure 2.31a exhibits an area near a junction of grains
inside a specimen deformed to failure under biaxial
confinement. This shows an area of higher localized
deformation and formation of cells or the beginning of
disintegration of the inner lamellar structure of grains.
With the increase in deformation, the number density of
cells increases due to breakdown of the subgrains. As the
strain increases, the inner structure of columnar‐grained
sea ice deteriorates to polygonized state and becomes
unrecognizable to untrained eyes. Completely polygonized
ice may be mistaken as granular ice. This is demonstrated
in Figure 2.31b. It shows an area of the ice that is par-
tially polygonized. This was particularly selected to show
a few rows of brine pockets in a small segment on the left.
During deformation, brine and air pockets are also forced
to move and coagulate. A few coalesced pockets can also
be seen in the micrograph. Note also the presence of both
slip lines and tilt lines, in criss‐cross form on the left.
It is fitting to remark here that conventional cross‐polar-
ized light examinations can also reveal small‐angle tilt
boundaries, provided thin sections are prepared by solid‐
state double‐microtoming technique to avoid any possi-
bilities of introducing artefacts caused by conventionally
used warm‐to‐touch glass plates. However, it may require
trained observers to recognize them. An example is given in
Figure 2.32 for deformed ice following biaxially confined
strength test. Note the stripes or narrow bands with slightly
different shades of color inside the grains. These intragran-
ular bands correspond to ice with slightly different
c
‐axis
orientation and are separated by straight lines—the small‐
angle tilt boundaries. This illustration also shows many
grains that were deformed to larger strains when the narrow
bands of ice were broken down to smaller units, leading to
cells or polygonized stages depending on localized strains.
These types of features are commonly seen in naturally
deformed ice in rubble field or ridges. However, untrained
eyes may consider these areas of polygonized (often called
as recrystallized) ice as snow or granular ice. Not surpris-
ingly, sea ice ridges have commonly been described as full
of snow ice. The topics related to large‐scale deformation
and formation of ridges and rubbles will be presented later
in section 2.4.
Tilt boundary
1 mm
Figure 2.30
Photomicrograph of a thermally etched surface,
normal to the length of a columnar grain, after biaxial strength
tests; “small‐angle tilt boundaries,” visible as straight lines par-
allel to c‐axis are linked to inclusions as stress concentration
points (Micrograph by N. K. Sinha, unpublished).