Geology Reference
In-Depth Information
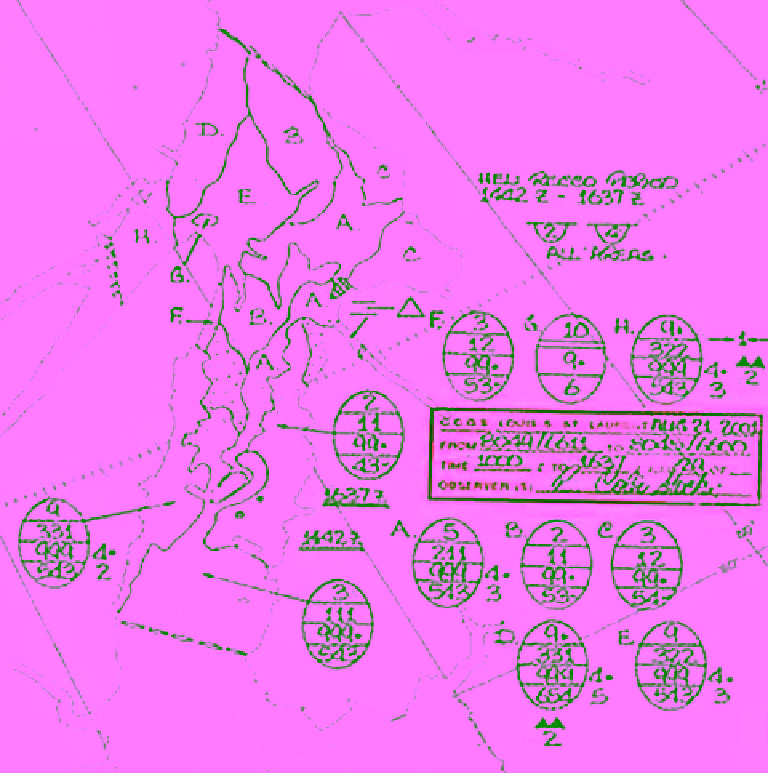
Figure 11.7
Example of an ice chart produced manually during a helicopter flight by an Ice Service specialist
[
MANICE
, 2005].
making ship routing and escorting. The product is also
delivered to the Canadian Meteorological Center and to
the ice modeling group at CIS to support its modeling
activities. It is also used by ice forecasters to supplement
the daily ice analysis and regional analysis charts.
Radarsat ScanSAR wide and narrow modes are often
used to retrieve ice information in operational areas
because they provide good geographic coverage and ade-
quate temporal resolution. The wide mode offers swath
of nearly 500 km at nominal spatial resolution of 100 m.
The narrow mode has a swath width of 300 m with nomi-
nal resolution of 50 m. A fast turnaround of the Radarsat
images has been made possible with delivery times to CIS
averaging less than 2 h from the satellite overpass. The
image analysis is conducted visually by experienced ice
analysts in CIS using ISIS. As mentioned above, this is
mainly an image display system that comprises a series of
servers and workstations as well as GIS software. ISIS
can geocode the image, combine a few images to form a
mosaic of the full orbit (an orbit data stream is usually
chopped into frames of ground dimensions 500 × 500 km
2
),
and draw lines to define areas of homogeneous ice attrib-
utes in the image. All Radarsat data are displayed on ISIS
in Lambert Conformal Conic projection.
The first step in the Radarsat image analysis is to delin-
eate polygons, called ice analysis polygons (IAP), in the
image. Each polygon, in the analyst's view, is an area of
homogeneous sea ice attributes, i.e., the ice types and
their concentrations are uniformly distributed across
the polygon. This is a subjective process and therefore
the result may differ between different analysts. Rules are
established to guide the process of polygon delineation
[
MANICE
, 2005]. In the second step the analyst estimates
the ice attributes for each polygon; namely, total ice con-
centration, ice types, partial concentration of each type,
and predominant form of each ice type. The system will
then generate the egg code for the polygon. An example
of a Radarsat‐1 image analysis is presented in Figure 11.8.
It displays a few IAPs with an egg code attached to three
of them. The scene is from the Baffin Bay acquired on 6
November, 2003. Image analysis charts are useful as a
source for tactical navigating of ships and icebreakers.