Geology Reference
In-Depth Information
(a)
(b)
(c)
100%
b) August, 2002
AMSR Ice Temp.
AVHRR Ice Temp.
98%
94%
90%
86%
82%
78%
74 %
70%
66%
62%
58%
54%
50%
46%
42%
38%
34%
30%
26%
22%
18%
14%
45°E
80°S
70°S
60°S
10%
<8%
135°W
135°E
August 13-26, 2002
August 13-26, 2002
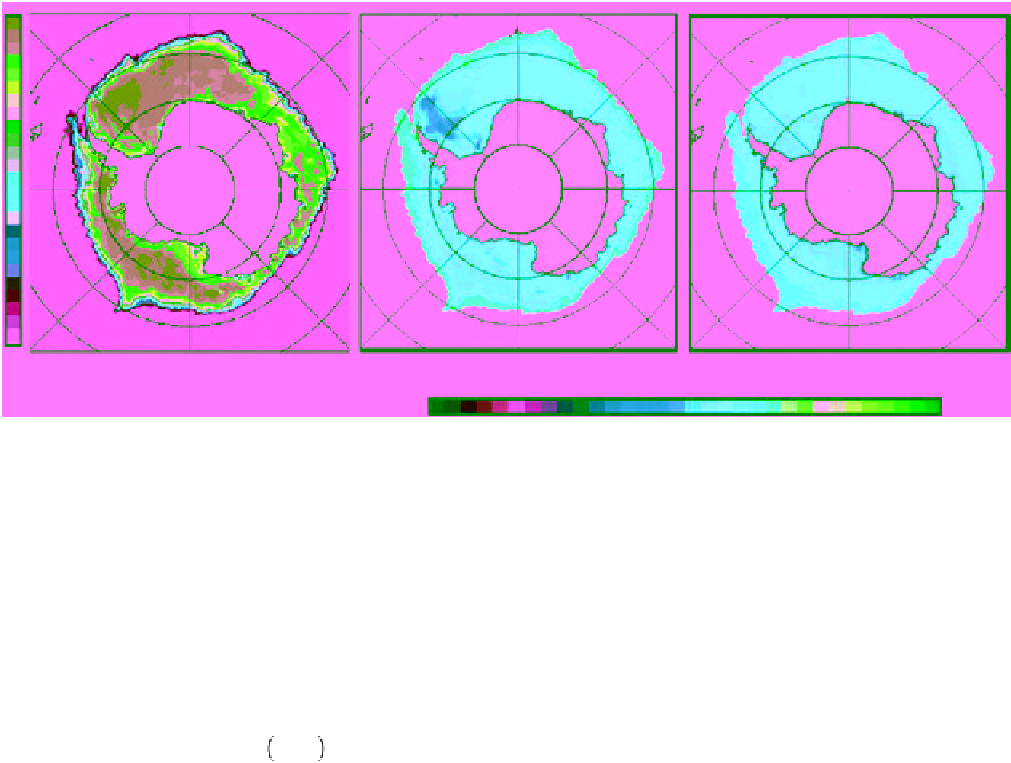
Figure 10.43
Winter ice concentration in (a) the Southern Ocean using Bootstrap algorithm, and comparison
between ice surface temperatures derived from (b) AMSR‐E and (c) AVHRR, respectively. The results from AMSR‐
E represent the snow‐ice interface temperature while the results from AVHRR represent the skin temperature
[adapted from
Comiso et al
., 2003]. (For color detail, please see color plate section).
is the name of the product, but it is actually the tempera-
ture of the radiating layer) can then be estimated using
the equation
makes the temperature of the snow‐ice interface mark-
edly warmer than the skin temperature).
Another discrepancy between the two data sets in
Figure 10.43 is observed in the western part of the
Weddell Sea, where ice temperature estimates from
AMSR‐E are colder than those from AVHRR (the
greenish area). According to
Comiso et al
. [2003], this
is due to the presence of MY ice floes that were advected
by the Weddell Gyre. The AVHRR‐derived skin surface
temperature represents the snow temperature, which is
equal across both FY and MY ice. On the other hand,
AMSR‐E captures the difference between the radiating
layer temperature of MY and FY ice (the former is
colder).
(10.102)
T
[
T
T CC
1
]/
RL ice
RL W
where
T
OW
is the open‐water temperature.
Comiso et al
. [2003] assessed the accuracy of the
retrieved ice temperature from AMSR‐E using coincident
ice temperature maps from AVHRR. Results are shown
in Figure 10.43 for winter ice data obtained from the
Southern Ocean in August 2002. Pack ice and ice edge
regions are shown on the ice concentration map.
Comparison between IST retrieval from AMSR‐E and
AVHRR is also presented. The IST estimates from the
two sensors seem to be in general agreement. The domi-
nant temperature in both maps is around 266 K, and the
average difference between the two estimates in the pack
ice is less than 2 K. However, discrepancies are visible, as
expected, around the ice edge where AMSR‐E shows
warmer temperatures. The skin temperature obtained
from AVHRR is colder than the radiating layer tempera-
ture from AMSR‐E. The latter is particularly warmer in
the case of thin ice, which commonly exists at the ice
edge. It can also be warmer because it most likely cap-
tures the relatively warm temperature of the snow‐ice
interface (recall that in the Antarctic the snow on sea ice
is thicker with a steeper temperature gradient, which
10.6. snow depTh over sea Ice
As mentioned in section 7.7.3 information on the dis-
tribution of snow depth on sea ice is important to esti-
mate the heat and energy exchange between the ocean
and the atmosphere. That is because thermal conductiv-
ity of snow is almost an order of magnitude less than
that of sea ice [
Maykut and Untersteiner
, 1971].
Moreover, albedo from snow can be twice as high as
albedo from the sea ice surface. The snow depth is
highly variable in the Arctic and more so in the
Antarctic, both spatially and temporally. The reason is
that the ice cover that prevails across the entire Arctic
Ocean in winter restrains the water vapor from the