Geology Reference
In-Depth Information
split‐window technique. Although this may be considered
an acceptable accuracy for most applications, the limita-
tion on using the TIR data remains to be the difficulty of
identifying a cloud‐free sky using an appropriate cloud
mask algorithm. For example, it is not possible to estimate
IST accurately from MODIS TIR data in the presence of
even thin clouds or fog [
Hall et al
., 2004]. A possible alter-
native is by using passive microwave data, separately or in
conjunction with the TIR data, as described later. Another
alternative is by deriving IST under cloudy sky from a near
coincident value under clear sky.
Key and Wong
[1999] presented an empirical equation
to estimate the IST under cloudy sky
T
cld
if the tempera-
ture under clear sky
T
clr
is given along with three other
parameters: the cloud optical depth
τ
, wind speed
u
, and
the total snow and ice thickness
H
s
. The
T
clr
can be
obtained from either nearby pixel or past record. The
equation is given here, but it should be noted that it has
not been widely applied:
220
222
224
226
228
230
232
234
236
238
240
242
244
246
248
250
252
254
256
258
260
262
264
266
268
270
Cold MY ice
Ice bridge
Greenland
Fast ice
Fast ice
Baffin Bay
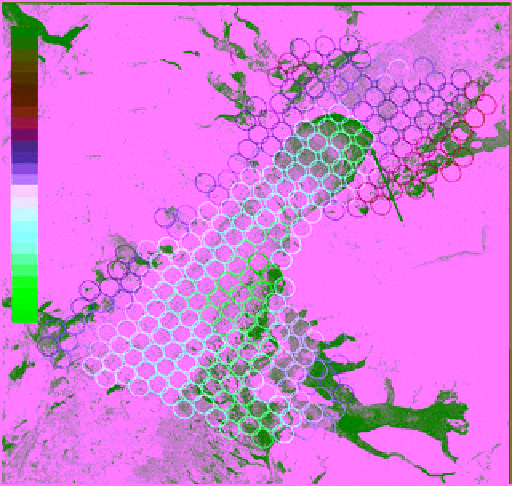
Figure 10.42
A Radarsat‐1 image of the NOW Polynya acquired
on 24 March, 1998 at 100 m spatial resolution with superim-
posed ellipses that represent footprints of SSM/I 85 GHz
channel overlaid. The footprints are color‐coded to represent
the surface temperature calculated from the TIR channels of
a near‐coincident overpass of AVHRR. Cold temperatures
correspond to thick ice or fast ice while warm temperatures
correspond to thin ice in the active polynys [Shokr, 2001].
(For color detail, please see color plate section).
2
TbbT bb
b
cld
0
1
clr
2
3
2
(10.97)
ln
b
(ln
)
bu bHs
s
4
5
6
7
where
μ
is the cosine of the solar zenith angle. Cloud opti-
cal depth can be obtained from satellite data, while the
wind speed and snow and ice thickness can only be
obtained from ancillary data. The coefficients
b
i
are
obtained by regressing the two sets of data: ice tempera-
ture under cloud and under clear‐sky conditions.
Key and
Wong
[1999] determined that the uncertainty of the results
from equation (10.97) to be about 2K. They also pre-
sented data that showed a linear increase of the IST with
the longwave downwelling flux during the winter in the
Arctic. In general, they found IST to be highest for low
wind speeds as heat was not removed from the surface as
readily did through turbulent transfer under high wind.
Ice surface temperature can be used to identify active
thin ice areas in a polynya. Since polynyas encompass thin
ice types and thick FY ice, warm surface temperatures
usually mark thin ice cover. Using the same split‐window
technique of
Key et al
. [1997],
Shokr
[2001] calculated
AVHRR‐derived surface temperature of the North Water
Polynya (NOW). Results were overlaid on a coincident
Radarsat‐1 image as shown in Figure 10.42. The data were
obtained on 24 March, 1998, 2 weeks after the formation
of the ice bridge (also called an ice arch) that blocked the
ice flow from the Arctic Ocean southward to Baffin Bay.
The formation of the bridge marks the beginning of the
active period of the polynya. The temperature estimates
can be verified using the finer resolution data of Radarsat‐1
(100 m resolution). Cold thick MY and FY ice existed
upstream of the bridge while OW and thin ice covers a
large area downstream from it. This is confirmed by the
temperature data, which are presented in the figure by the
colored ellipses. The ellipses represent the footprints of
the SSM/I 85 GHz channel. The high surface temperature
area in the middle of the polynya is covered with thin ice
and OW. The two cold ice temperatures at the two sides of
the polynya are covered mainly with thick fast ice.
10.5.2. Using Passive Microwave Observations
Passive microwave data have been used to estimate
the temperature of the radiating layer of the ice and its
snow cover, which is sometimes referred to (imprecisely)
as ice surface temperature. This is different from the
skin temperature estimated using TIR data (which is
much closer to the actual surface temperature). The
penetration depth of the TIR and microwave radiation
in sea ice measures in submillimeters and millimeters,
respectively. With this difference, the IST derived from
microwave observations is not directly comparable with
the temperatures derived from the TIR observations.
The temperature estimated from the microwave observa-
tions is integrated over a certain depth. It is commonly
assumed to be equivalent to the temperature of the snow
ice interface for FY ice or a weighted temperature of the