Geology Reference
In-Depth Information
10.5.1. Using TIR Observations
but the algorithm incorporates a capability for cloud fil-
tering. The algorithm and examples of the product are
given in
Hall et al.
[2004]. An estimated IST selected from
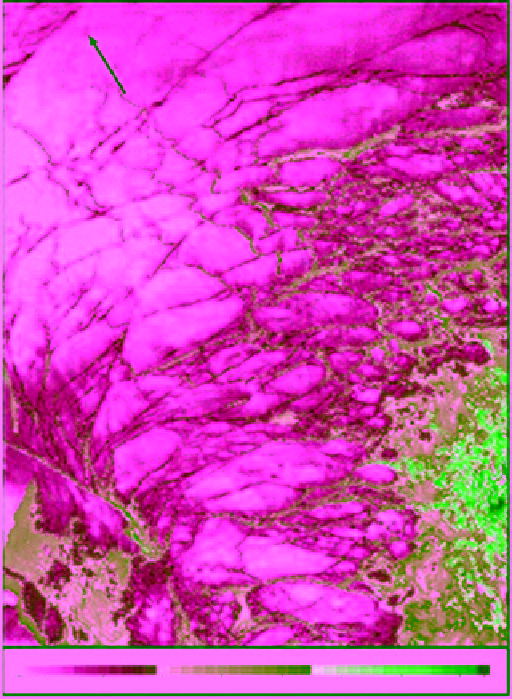
this study is shown in Figure 10.41. The scene shows ice
cover in the northern Greenland Sea. Recent refrozen
leads can be identified by their relatively high IST. In the
absence of validation data, it can be assumed that the
area of relatively high temperature at the bottom right
and left corners of the figure is thin ice. The surface of
thin ice is relatively warm because it is more readily
affected by the heat conduction from the warmer seawa-
ter temperature at the underside of the ice sheet. This
concept was used to identify thin ice types from the IST
measurements [
Stone and Key
, 1993]. Based on this it can
be assumed that the very cold floes (white color) in
Figure 10.41 are thicker than the surrounding ice.
While
Hall et al
. [2004] found the accuracy of the
MODIS‐derived IST to be within 1.2-1.3 K,
Key et al
.
[1997] reported a wider range of 0.3-2.1 K using the same
The theoretical background for surface temperature
retrieval from the TIR observations is presented in sec-
tion 7.5. As mentioned, the radiated energy in this spec-
tral region is proportional to the fourth power of the
physical temperature of the radiating medium [equation
(7.26)]. Therefore, it is easy to detect variations in physi-
cal temperature since small changes of this parameter
trigger large changes in the emitted radiation.
One of the studies that utilized the split-window tech-
nique [equation (7.55)] to estimate the IST is presented in
Maslanik et al.
[2001]. They used AVHRR observations
acquired over the western Arctic in April-July 1998 dur-
ing the SHEBA project (see section 10.1.1) to produce a
suite of parameters that included all‐sky surface tempe-
rature, broadband albedo, upwelling and downwelling
shortwave radiation, in addition to a few cloud products.
A key observation from the study was the above‐freezing
IST obtained within the ice pack. Upon stratifying the
AVHRR‐derived IST as a function of SSM/I‐derived ice
concentration, the study concluded that heating of open
water within the pack ice contributed to ice surface tem-
peratures that could be several degrees above the freezing
point even when a substantial amount of ice is present. In
other words, the temperature of an area that contains ice
and OW increases nonlinearly with the OW fraction. A
relevant conclusion from the study of
Maslanik et al.
[2001, p. 15, 243] states that this increase “contrasts with
the assumption typically used in climate models, where
open water is prescribed to remain at the freezing point
until all ice is melted within a grid cell.”
Haggerty et al.
[2003] evaluated the AVHRR‐derived
IST also during the period of the SHEBA experiment
using surface‐based and airborne pyrometer measure-
ments acquired at high temporal and spatial frequencies.
The IST data were obtained through the NOAA/NASA
AVHRR polar pathfinder project [
Casey et al.
, 2010].
This product is also based on the same empirical formulas
of the split‐window equation with model simulations of
sensor radiances using Arctic and Antarctic radiosondes
to determine the coefficients.
Haggerty et al.
[2003] con-
cluded that the differences between the AVHRR and the
airborne pyrometer estimates of surface temperature were
between 0.2 and 1.5 K. This was within the error range
specified for the AVHRR‐derived IST. The errors were
attributed to deficiencies in cloud masking and spatial
heterogeneity of the surface. The authors noted also that
the differences between surface temperature of refrozen
lead and pack ice in May were relatively large and reached
12 K. Ice in a refrozen lead is always thinner than the
surrounding ice.
The IST is a standard product from MODIS at 1 km
resolution using the same basic equation [equation (7.55)],
N
Refrozen leads
Sea ice surface tempeature (K)
-233235
240
245
250
255
260
265
270 -271.5
Figure 10.41
Terra MODIS product of ice surface temperature
of a scene in the northern Greenland Sea acquired on 12 March,
2003. The center of the image is at 81.7°N and 1.0°E. Warmer
temperature (bottom right and left) indicates refrozen leads or
thin ice sheet [
Hall et al.,
2004, Figure 3, with permission from
IEEE]. (For color detail, please see color plate section).