Geology Reference
In-Depth Information
(a)
(b)
-5
-10
-15
-20
Thin ice
-25
HH
HV
VV
-30
-35
0
30
60
90
120
150
Ice thickness (cm)
(c)
(d)
3.0
150
2.5
120
2.0
90
1. 5
60
1. 0
30
0.5
0.0
0
0
30
60
90
120
150
0
30 60
Observed ice thickness (cm)
90
120
150
Ice thickness (cm)
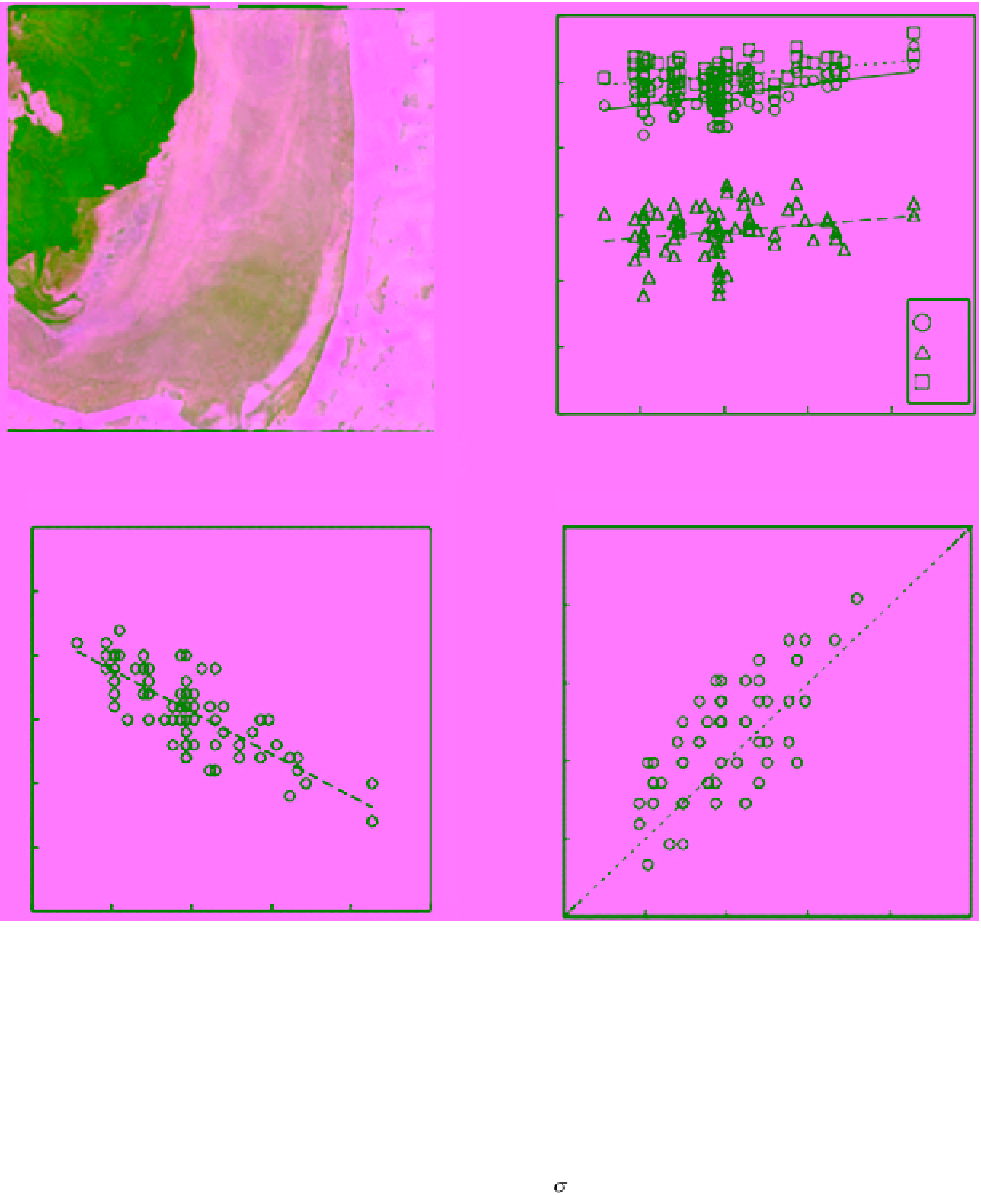
Figure 10.37
(a) X‐band airborne polarimetric SAR data from the Sea of Okhotsk in January 1997; (b) backscattering
coefficient versus ice thickness; (c) co‐polarization ratio versus ice thickness, and (d) observed versus estimated
thickness [Adapted from
Nakamura et al
., 2005].
polarimetric SAR parameters for ice thickness retrieval
under different surface conditions.
Using PALSAR L‐band data,
Toyota et al.
[2011] found
a correlation between backscatter measurements from the
HH channel and in situ measurements of ice thickness
and surface roughness. The experiment was conducted
in the southern area of the Sea of Okhotsk in February
2008. The surface roughness was measured using a heli-
copter‐borne laser profiler. The linear equation that can
be used to estimate the ice thickness (in meters) is
0
H
0 047
.
1 012
.
(10.96)
hh
0
is in decibels.
Toyota et al.
[2011) found that
the RMS error between measured and estimated ice
thickness using the above equation is 0.04 m, and the
correlation coefficient between them is 0.86; significant
at 99% level. The equation can be applied to estimate
ice thickness in the range from 0.2 to 0.6 m, exclud-
ing deformed ice. The same study presents a linear
where
hh