Geology Reference
In-Depth Information
RADARSAT image of sea ice
ICE Sat track
0
-2
-4
-6
-8
New lead with thin ice
'Reference thickness estimated using ice age from RGPS
0
20
40
60
Along-track distance (km)
80
100
120
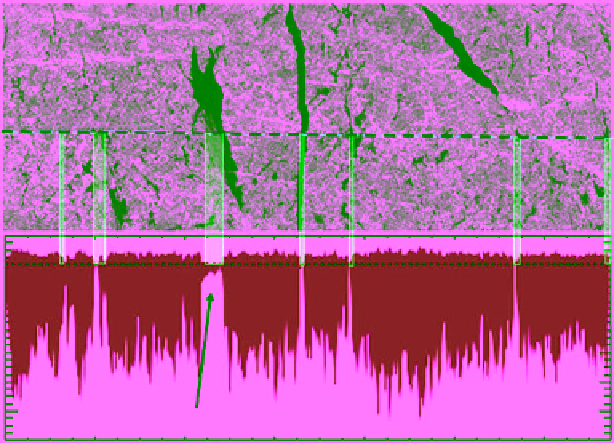
Figure 10.35
A RADARSAT image acquired on 20 March 2003 north of Ellesmere Island in the Arctic region (top)
and a near‐coincident ICESat‐derived thickness estimate (bottom). The dark objects in the Radarsat image are new
leads or openings in the ice cover. The dashed line in the top panel is the ICESat‐1 track. The dotted line in the
bottom panel is the zero reference line of seawater surface (separating the freeboard and the draft). The bands
connecting the top and bottom panels highlight areas of thin ice or OW in the Radarsat image [adapted from
Kwok
et al
., 2004, Figure 2, with permission from AGU].
polar regions). Figure 10.36 shows the evolution of ice
thickness maps of the Arctic between 2004 and 2008
[
Kwok and Sulsky
, 2010]. A significant drop of about
0.6 m in MY ice thickness (and consequently overall ice
thickness) is observed over the 4 years since 2005. The
rate of thickness decrease is about 0.17 m per year. On
the other hand, the average thickness of FY ice seems to
remain at the 2 m level with no apparent trend of decrease.
More quantitative analysis of this data set reveals that the
relative contributions of MY ice and FY ice to the total
ice volume were reversed recently. In 2003, 62% of the
total ice volume in the Arctic was stored as MY ice. By
2008, only 32% was MY ice and the rest (68%) was FY
ice. Based on the 42% reduction of MY ice areal coverage
between 2005 and 2009 [
Kwok et al
., 2009], the corre-
sponding reduction in Arctic ice volume was estimated
from the ICESat‐1 data to be > 40% [
Kwok
, 2010]. This is
a net loss of 6300 km
3
in the 4 year period. This kind of
information is considered to be the most valuable contri-
bution of the laser altimetry data.
Price et al
. [2013] present a method of retrieval of
fast‐ice freeboard in McMurdo Sound, Antarctica, using
ICESat laser altimeter. They pointed out the formation
of a platelet ice layer under the ice-water interface (see
section 2.3.2) as a source of error that increases the meas-
ured freeboard and therefore leads to the overestimation
of ice thickness. The layer is driven by the outflow of
supercooled water from beneath the McMurdo Ice Shelf.
This is a very porous layer but with a certain solid frac-
tion. It should be noted also that clouds and atmospheric
constituents are additional sources of error that should
be corrected. Other preprocessing tasks include correc-
tions for tides and orbit deviation.
Radar altimeters, on the other hand, have been used to
estimate ice thickness since the launch of the first instru-
ment onboard ERS‐1 in 1991. A carbon copy of this sen-
sor was part of the payload on ERS‐2 (launched in 1995)
and again on ENVISAT (launched in 2000).
Laxon et al
.
[2003] used radar altimeter data from ERS‐1 and ERS‐2
to compile an ice thickness map for the Arctic region in
winter (October-March), averaged over an 8 year period
from 1993 to 2001. This has been used as a reference
map to estimate the change in Arctic ice thickness from
more recent instruments. Data were not available in the
marginal ice zone or above the ERS latitudinal limit
of 81.58°N. The authors stated that accuracy of the ice
thickness estimates was within 11 cm.
The first satellite with a sole payload of a radar altim-
etry dedicated to monitoring the changes in floating ice
thickness in the polar oceans has been the ESA's Earth
Explorer CryoSat‐2. It was launched on 8 April 2010,
almost 5 years after its predecessor CryoSat‐1 was lost
in a launch failure. The altimeter on CryoSat‐2 is called
SAR Interferometric Radar Altimeter (SIRAL). The