Geology Reference
In-Depth Information
260
240
220
200
180
160
140
T
ice
= -20°
T
ice
= -10°
120
T
ice
= -5°
T
ice
= -2°
H
max
100
80
0.0
0.2
0.4
Ice thickness [m]
0.6
0.8
1. 0
Figure 10.33
Variation of brightness temperature from the SMOS L‐band sensor as a function of ice thickness
[following equation 10.85] for different bulk ice temperatures and constant bulk salinity of 0.65‰ and surface
roughness = 0.1 of ice thickness
H
max
is determined from equation (10.88). [
Kaleschke et al
., 2010, Figure 2, with
permission from the author].
climatic application needs.
Kaleschke et al
. [2010] shows
maps of retrieved ice thickness and provide indications
of the ice types (FY ice or MY ice). Comparison of ice
thickness maps obtained between successive weeks
shows the rate or propagation of the FY ice cover in the
Arctic basin during the month of November.
h
Snow
10.4.3. Altimeter Observations
f
flaser
f
radar
Reference level
Laser or radar altimeter measurements can be used to
estimatie ice thickness. Unlike the TIR and microwave
sensors, an altimeter can provide estimates within the full
range of possible thickness, from a few centimetres of YI
types to a few meters of MY ice. Ice thickness is calcu-
lated based on an estimation of the freeboard of the ice
sheet, which is measured by the same sensor. Accuracy of
the calculated ice thickness is tied to the uncertainties in
the estimation of the freeboard. The latter is estimated
with increasing uncertainty as ice becomes thinner (even
if it is a few tens of centimeters thick). That is where
thickness estimates from passive microwave sensors can
augment estimates from altimeters.
Kwok et al
. [2007]
determined the mean freeboard of FY ice and MY ice in
the Arctic to be 14 and 35 cm in the fall, and 27 and 43 cm
in the winter. The increases of 13 cm of FY ice and 8 cm
of MY ice freeboard during winter are caused by the 4
months of ice growth and snow accumulation.
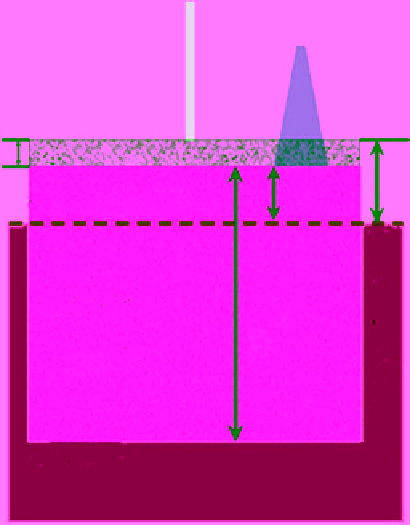
Figure 10.34 is a schematic diagram showing the prin-
ciples of operations of the laser and radar altimeter
beams as well as definitions of parameters used in the
H
Sea ice
Ocean
Figure 10.34
Schematic diagram showing the principles of
observations of the laser and radar altimeter beams with defi-
nitions of the freeboard
f
flaser
and
f
radar
, the snow depth (
h
) and
ice thickness (
H
).
derivation of the ice thickness. The figure compares the
path of the laser and radar beams and the definition of
the freeboard
f
flaser
and
f
radar
, respectively. The transmitted