Geology Reference
In-Depth Information
(a)
(b)
(c)
(m)
(K)
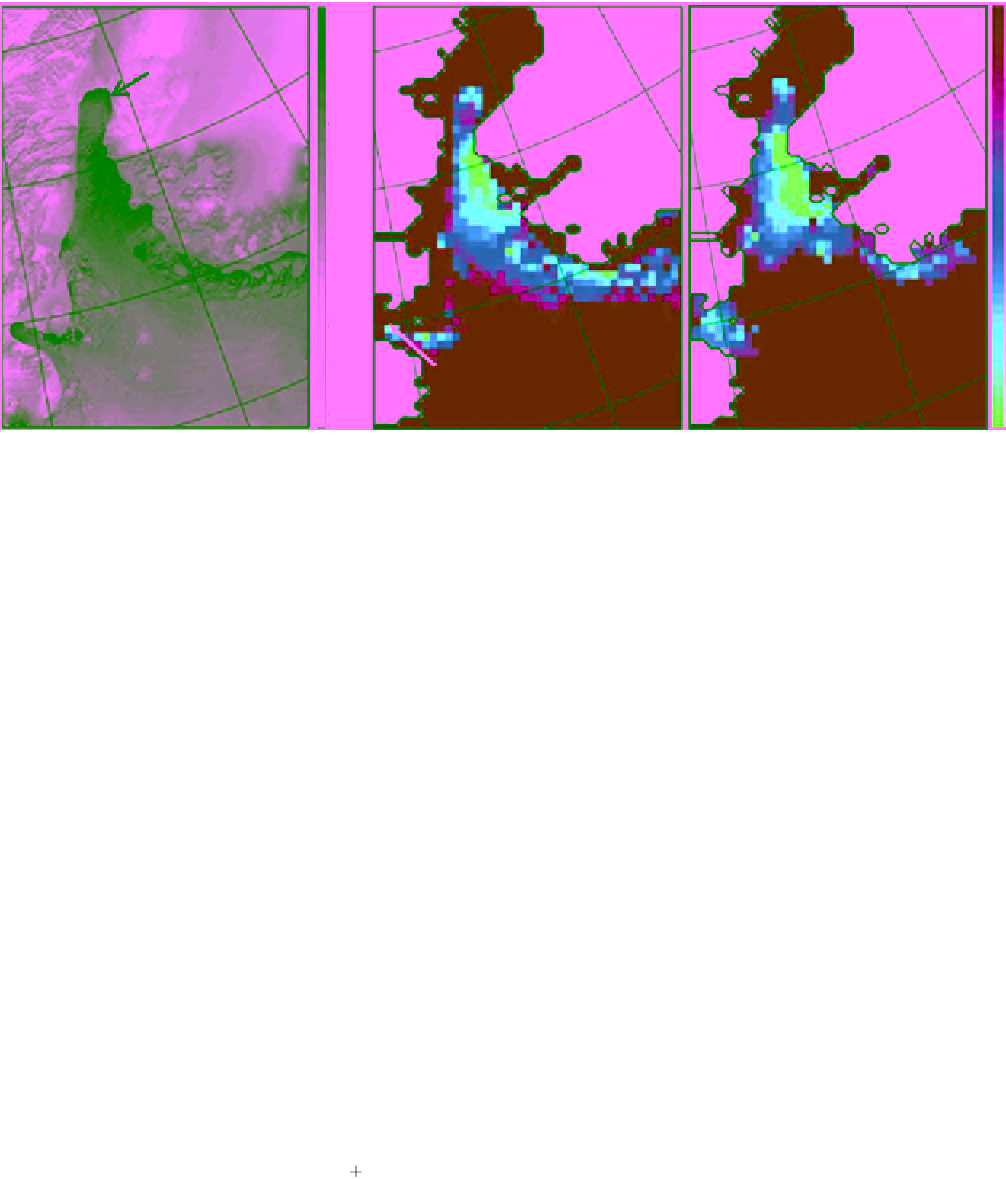
Ice arch
0.15
260
0.1
250
240
0.5
Jones Sound
Baffin Bay
230
0.0
Figure 10.31
Estimates of ice thickness using AVHRR and SSM/I in the North Water Polynya (a) and (b), respectively.
The corresponding ice surface temperature derived from AVHRR data is shown in (c) [adapted from
Tamura and
Ohshima
, 2011, Figure 2, with permission from AGU]. (For color detail, please see color plate section).
integrated water vapor contents. Note that the difference
in the size of the footprints between the 36 and 89 GHz
channels (the former is twice the latter) may cause an
error in the relationship between PR
36
and PR
89
shown in
Figure 10.32. Based on a similar scatterplot such as the
one shown in this figure,
Tamura et al
. [2007] derived
an equation to delineate a boundary that separates the
cloudy and cloud‐free data points. The boundary is
established as follows. Data from the PR
36
of clear sky
are segmented into 0.005 intervals. The mean and stand-
ard deviation of PR
89
for each segment is calculated.
Then, a least‐squares quadratic equation is established
from the mean values minus twice the standard deviation
of each segment. This is shown by the solid curve in
Figure 10.32. The equation of this curve (developed for
the Chukchi Sea Polynya data using AMSR‐E data) is
0.20
0.15
0.10
0.05
0.00
0.0
0.05
0.10
0.15
0.20
PR
36
(10.82)
PR
32
.
(PR
)
2
0 077
.
(PR
)
0 0066
.
89
36
36
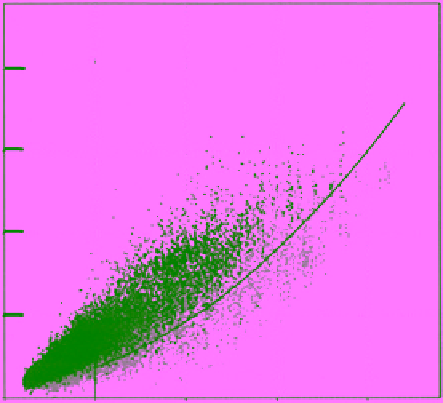
Figure 10.32
Scatterplot of AMSR‐E polarization ratio PR
36
versus PR
89
for clear sky (black dots) and sky with cloud or high
water vapor contents (red dots). The solid curve is the bound-
ary that separates the two groups [equation (10.82)]. Pixels
below that boundary with PR
36
> 0.05 are excluded from the
ice thickness calculation [
Iwamoto et al
., 2013, Figure 2, with
permission from Taylor and Francis]. (For color detail, please
see color plate section).
A similar equation is presented in
Tamura et al
. [2007]
for data from the Antarctic Ocean (developed for
SSM/I data):
(10.83)
PR
4 492
.
(PR
)
2
0 1062
.
(PR
)
0 01336
.
85
37
37
The pixels below the curve defined by equation (10.82) in
Figure 10.32 with PR
36
> 0.05 are considered to be influ-
enced by clouds or atmospheric water vapor and therefore
excluded from the calculations of thin ice thickness. It is
obvious that this method minimizes the error due to clouds
but does not eliminate it. Alternatively, a semiempirical
radiative transfer model can be used to account for the
atmospheric influences on the 85 or 89 GHz observations
[e.g.,
Gloersen and Cavalieri
, 1986;
Kern
, 2001].