Geology Reference
In-Depth Information
This corresponds to a thickness range between 0.01
and 0.075 m.
This corresponds to a thickness range between 0.075
and 0.15 m.
Note the larger thickness range that can be estimated
using PR
37
. These two equations are used as follows.
Equation (10.79) is used first and for the prescribed
range of PR
85
. Values of PR
85
≥ 0.0494 correspond to an
H
4 565
.
PR
0 3492
.
for
006
.
PR
0 0436
.
37
37
(10.80)
(a)
(b)
0.30
0.30
PR
85
PR
37
0.25
0.25
0.20
0.20
0.15
0.15
0.10
0.10
0.05
0.05
0.00
0.00
0.00
0.00
0.02
0.04
0.06
0.08
0.10
0.12
0.02
0.04
0.06
0.08
0.10
0.12
(c)
(d)
0.30
0.30
PR
85
PR
37
0.25
0.25
0.20
0.20
0.15
0.15
0.10
0.10
0.05
0.05
0.00
0.00
0.00
0.00
0.02
0.04
0.06
0.08
0.10
0.12
0.02
0.04
0.06
0.08
0.10
0.12
SSM/I PR
SSM/I PR
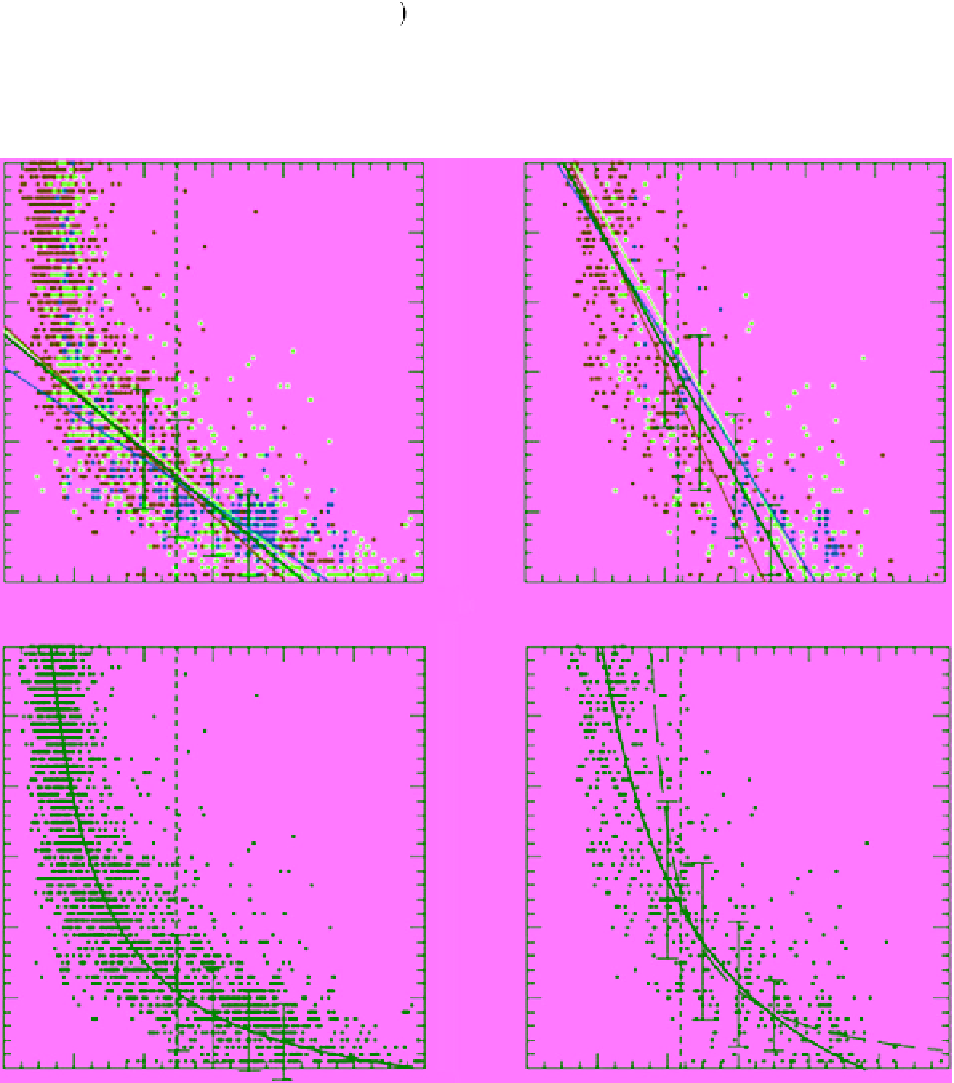
Figure 10.30
Scatterplots of AVHRR‐derived ice thickness and SSM/I PR
85
and PR
37
. The solid black line in
the top panels denotes the linear regression and in the bottom panels the exponential regression. The vertical
lines with crossbars show the standard deviation of the plots with respect to the regression curve. The blue,
red, and green points in the top panels represent data from the NOW Polynya, Chukchi Polynya, and Laptev
Polynya, respectively. Regression line from each data set shown in the same color [
Tamura and Ohshima
,
2011, Figure 3, with permission from AGU]. (For color detail, please see color plate section).