Geology Reference
In-Depth Information
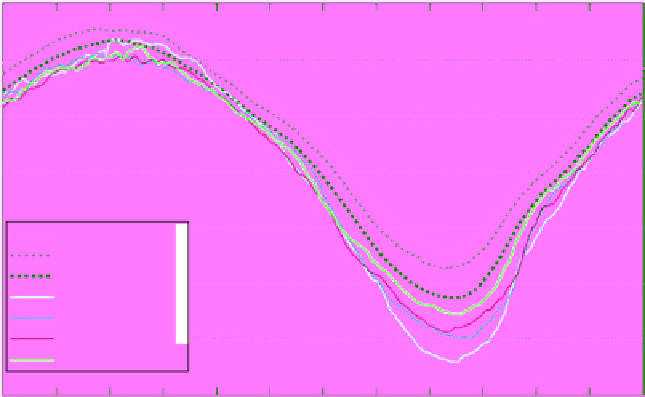
Arctic sea ice extent (ver. 2)
2014/12/31
16
IARC-JAXA
14
12
10
8
1980's Average
1990's Average
2000's Average
6
2012 (1st Lowest)
2007 (2nd Lowest)
2011 (3rd Lowest)
4
2014
2
Jan eb
Mar
Apr
May un
Jul
ug
Sep
Oct
Nov
Dec
Figure 10.27
Records of Arctic ice extent from the lowest 3 years on record, the current year (2014), and the
decades averages of 1980s, 1990s, and 2000s [with permission from the Japan Aerospace Exploration Agency
(JAXA)]. (For color detail, please see color plate section).
Area
Extent
16
16
Asi
Bootstrap
14
14
Bristol
12
12
Calval
NASA team
10
10
NASA team2
Near90GHz
8
8
NORSEX
6
6
NORSEX85h
4
4
TUD
UMass-AES
2
2
Jan
Mar
May ul
2012
Sep
Nov
Jan
Mar
May ul
2012
Sep
Nov
Figure 10.28
Ice extent and ice area calculated from eight different microwave ice concentration algorithms in
the Arctic during 2012. Ice extent is more sensitive to differences in concentration output from different algo-
rithms. The minimum ice cover is always observed around mid‐September [courtesy of NANSEN Environmental
and Remote Sensing Centre, Norway]. (For color detail, please see color plate section).
end of June. On the other hand, the difference in ice extent
varies between 0.1 and 0.7 million km
2
with the maximum
occurring in the end of May.
Ivanova et al
. [2014] calcu-
lated the ice area and extent for two periods: 1979-2012
and 1992-2012 based on the low‐frequency and high‐
frequency passive microwave ice concentration algorithms
(algorithms under each category are mentioned in
section 10.2.2.4.). The results are presented in Table 10.3.
Note the accelerated decrease in sea ice in the second
period compared to the earlier period. Note also the
slightly larger spread in the results from the low‐frequency
algorithms. The overall rate of decrease of sea ice from
the 11 algorithms is also presented.
Ice area and extent are also produced regularly from
visible and TIR data. An example is the MODIS sea ice
algorithm, which discriminates between snow‐covered
sea ice and OW. The algorithm employs three criteria, all
established from data obtained from the TIR of the
MODIS Airborne Simulator (MAS) [
Riggs et al.,
1999].
The first is the reflectance in the visible and NIR wave-
length where snow has a much higher reflectance than
water. The second is the normalized difference snow