Geology Reference
In-Depth Information
In the first approach the set of polarimetric parameters
should be averaged over a specified neighborhood win-
dow (e.g., 5 × 5 pixels). This will make multilook (speckle‐
filtered) data. Without this step some parameters such as
entropy [equation (7.97)] cannot be interpreted correctly
because the randomness it represents is attributed to the
speckle noise not to authentic surface characteristics
(entropy tends to be near zero in this case). Since the
derived decomposition parameters can be interpreted in
terms of the scattering mechanisms (Figure 7.35),
Cloude
and Pottier
[1997] present a description of the scattering
characteristics in the two‐dimensional space of entropy
and alpha angle [see definitions in equation 7.99]. The
model has found applications in the field of agriculture
to discriminate crops, but more studies are expected to
be pursued in the future to examine its potential for sea
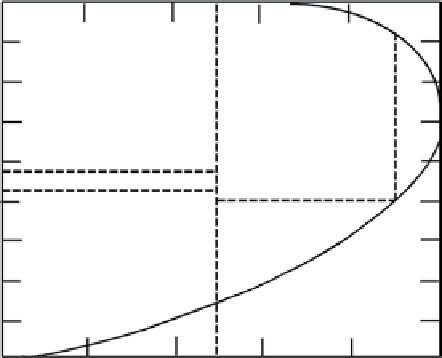
ice classification. The partitioning of the feasible domain
into different zones is shown in Figure 10.7 and the physi-
cal characteristics of the scattering associated with each
zone are given in Table 10.1. The zones in the original
figure in
Cloude and Pottier
[1997] are established based
on vegetation models. Here (in Figure 10.7) the zones
associated with scattering from vegetation are removed.
It is possible that new partitions can be generated to
signify same scattering mechanisms from ice types or
ice surfaces.
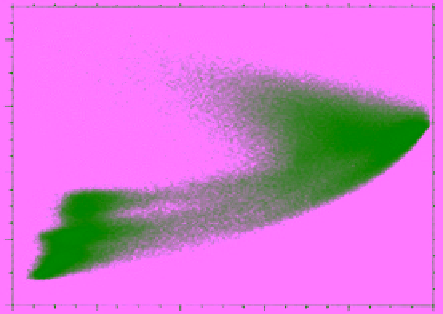
An example of the scatterplot in the entropy/alpha‐
angle space obtained from the JPL airborne AIRSAR
data over the city of San Francisco is shown in
Figure 10.8 [
Lee et al
., 1999]. Although a distinctive
cluster is located in zone Z2, three distinctive clusters
exist in zone Z7. Other applications in the agriculture
field pointed out the same problem. The partitioning in
Figure 10.7 represents the scattering mechanisms as
indicated in Table 10.1. Therefore, the grouping of
more than one cluster in a particular partition would
mean that the clusters represent objects with different
physical characteristics though they all lead to the
same scattering mechanism. That is what characterizes
the relevant zone in the entropy/alpha‐angle space.
Plotting data points in this parameter space can be use-
ful at least to identify centers of initial classes upon
which new pixels can be classified based on a metric
measure. It should be noted that
Lee et al
. [1999] used
this approach to develop an unsupervised classification
scheme combined with the maximum‐likelihood classi-
fier based on the complex Wishart distribution (which
is explained below). This method compensates for the
misclassification results from grouping more than one
class in the same zone.
In the second approach for ice classification using SAR
polarimetric data, the entire matrix representation of the
Table 10.1
Scattering characteristics of the zones in the
entropy and alpha‐angle space (see Figure 10.7).
Zone
Scattering Characteristics
Z1
Not feasible domain
Z2
High entropy multiple scattering
Z3
Medium entropy multiple scattering
Z4
Medium entropy surface scattering
Z5
Low entropy multiple scattering
90
Z6
Low entropy dipole scattering
Z1
80
Z7
Low entropy surface scattering
70
Z5
Z3
Z2
60
80
50
Z6
40
60
Z4
30
Z7
40
20
Z1
20
0
0.0
0.2
.04
0.6
0.8
1. 0
Entropy
0
0.0
0.2
0.4
0.6
0.8
1. 0
Figure 10.7
Partitioning of the entropy/alpha‐angle space
showing seven zones associated with different physical scat-
tering characteristic. Region Z1 represents a mathematically
unfeasible domain, (adapted from the original figure in
Cloude
and Pottier
, 1997].
Entropy
Figure 10.8
Scatterplot of entropy versus alpha‐angle derived
from the L‐band polarimetric AIRSAR data of San Francisco
[
Lee et al
., 1999, Figure 3, with permission from IEEE].