Geology Reference
In-Depth Information
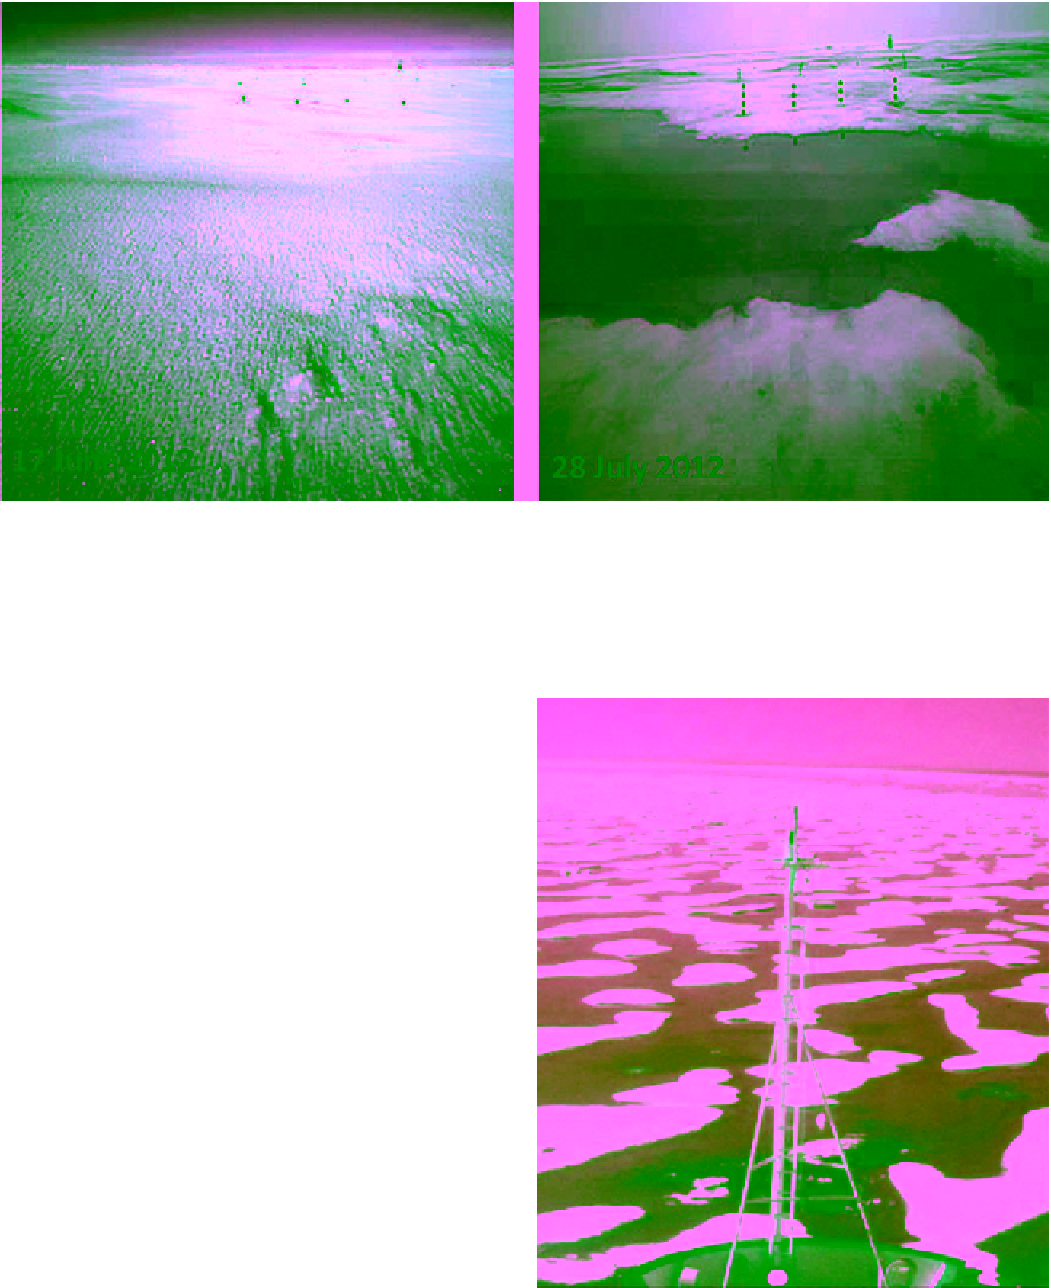
Figure 9.11
Two photograph of snow‐covered sea ice in the Arctic (same site) during onset of melt period (left)
and advanced melt (right) (from NOAA Arctic website).
solar radiation spatially different (section 2.5). Figure 9.11
shows snow‐covered ice surface during the premelting
phase and the same surface with melt ponds that appeared
6 weeks later. The photos were obtained using web cam-
eras deployed to monitor air, ice, and ocean conditions
within the USA-Japan joint project entitled North Pole
Environmental Observatory (NPEO). During the pond-
ing stage the sea ice surface is transformed into a hetero-
geneous mixture of light‐blue‐colored melt ponds and
white interstitial snow‐ice areas. In the last stage of ice
melt (ice decay) the ice surface develops into what is
known as “rotten ice.” This is an advanced stage of ice
disintegration where the surface becomes honey‐combed
with melt ponds covering more than 50% of the surface
area, as shown in Figure 9.12 [
MANICE
, 2005]. The rot-
ten ice phase is the least understood stage from a remote
sensing perspective, partly due to the lack of dedicated
field observations but most likely because of the hetero-
geneous footprint that contains pond water and ice. All
bands of remote sensing data (VIS, TIR, and microwave)
can be used to detect surface melt at each stage. The
measurements from each band that can be linked to
each stage are presented in the following section. The
extent of the ice melt is a direct function of atmospheric
temperature [
Markus et al
., 2009]. A few studies have
been conducted to explore changes and trends in the
timing of Arctic sea ice melt onset using remote sensing,
Figure 9.12
Rotten FY ice during the advanced decay phase,
showing extensive melt ponds and interstitial snow/ice areas
[
MANICE
, 2005, Canadian Ice Service].