Geology Reference
In-Depth Information
(a)
(b)
200
0.3
180
0.25
160
140
0.2
120
100
0.15
80
0.1
60
40
0.05
20
1 cm
~
70 m
0
(c)
(d)
250
0.9
0.8
200
0.7
0.6
150
0.5
0.4
100
0.3
0.2
50
0.1
0
0
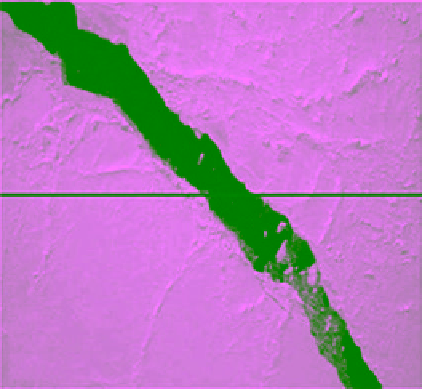
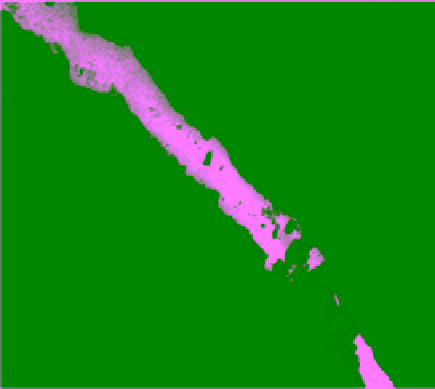
Figure 9.10
(a) Original DMS airborne image of ice sheet traversed by a lead and (b) the same image after applying
the
LVT
followed by the MST. It is much easier to detect the lead in (b) by applying a threshold. (c) another lead
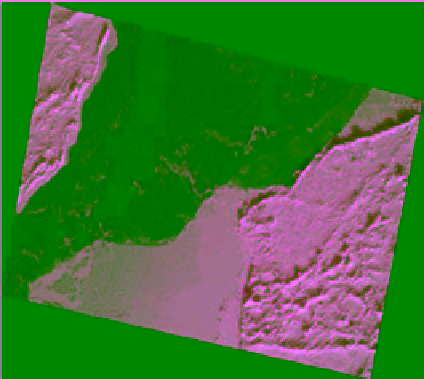
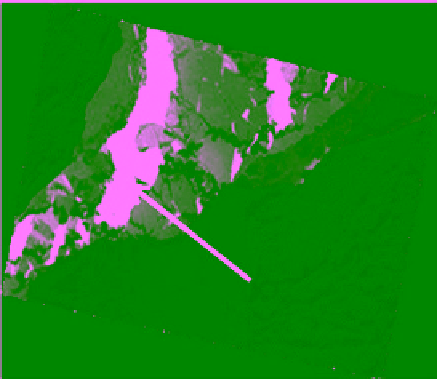
surrounded by sea ice, and (d) the resulting classification of the image in (c) after applying the minimal signal
transform where the dark, medium and light gray shades represent gray ice, thin ice, and OW, respectively. The
arrows point to OW [adapted from
Onana, et al
., 2003].
Arctic. The Canadian Ice Service has incorporated surface
melt as an additional entry in its ice mapping products
since the early 2000s [MANICE, 2005].
Interest in ice surface melt is also driven by climatic and
remote sensing requirements. The onset of melt and the
duration of the melt season are important factors that
enable the understanding of the Arctic climate system,
especially the surface heat budget. In addition, surface
melt changes microwave signature of the ice surface,
which usually leads to underestimation of ice concentra-
tion. Therefore, knowledge of surface melt fractions is
required to produce a more accurate estimation of ice
concentration in the summer [
Tschudi et al
., 2001]. Snow
on ice is more susceptible to melting due to its higher
melting point. The meltwater absorbs more solar radia-
tion and therefore triggers more snow and ice melting.
Melting of sea ice develops through three stages; each
one leaves its signature on the surface appearance. These
are premelting, advanced melting, and finally ice decay.
The premelting (also called onset of melting) is charac-
terized by a remarkable increase of wetness or degree of
waterlogging in the snow cover. In the case of a snow‐free
ice surface, quasi‐liquid films are formed on the surface.
In the advanced melting (also called the ponding phase),
sporadic melt ponds appear at the surface (Figure 2.57).
The sporadic distribution is linked to the spatial variation
of the snow depth and the uneven distribution of the sur-
face salinity, which make the absorption of the incoming