Geology Reference
In-Depth Information
Resources Engineering [
C‐CORE
, 2012]. The report aimed
at analyzing ridge‐like features and correlated them to in‐
situ data in order to develop a methodology to routinely
analyze high‐resolution images for the extraction of
extreme ridge feature. This work has been motivated by
a growing interest in exploiting the oil and gas resources
in the Arctic. Over 25% of the world's petroleum reser-
ves are believed to be in Arctic regions and other ice‐
frequented environments. C‐CORE is a Canadian
multidisciplinary R&D corporation established to address
challenges facing oil and gas development offshore the
east coast of Canada and the Arctic.
The above discussions focused on retrieving surface
deformations from SAR. However, optical remote sens-
ing data have also been used, though not very often, to
identify ridges and determine their statistics.
Johannessen
et al
. [2007] demonstrate limited applications of these
data and hint to a plan of using SAR and optical images
in operational ice service to monitor ice ridges in the
northern sea route.
North Pole
Beaufort Sea
Alaska
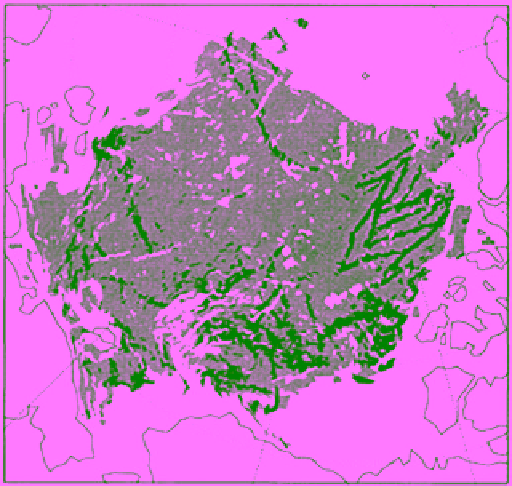
Figure 9.6
Map total deformation rates at the end of May 1998
calculated from a series of Radarsat images initiated in January
1998, produced by the RGPS. The 10% of the cells with the
largest deformation rates are shown in black. Note the quasi‐
linear forms of the concentration of large deformation [
Lindsay
and Stern
, 2003, Fig. 4 with permission from the American
Meteorological Society].
9.2. crackS anD LeaDS
Another ice surface feature of interest to marine navi-
gators and climate modelers is opening in ice cover. As
mentioned in the previous section, cracks and leads result
from divergence of the ice cover. This happens under ten-
sile failure of the ice in response to the stresses induced by
the differential motions of the overlaying air and under-
lying water. A crack is any fracture in an ice cover that
is typically less than 1 m wide (Figures 2.53 and 2.54)
while a lead is any opening navigable by surface vessel
[
MANICE
, 2005]. Its width varies from a few meters to a
few kilometers. Leads are formed from cracks or fissures
as they open up progressively under synoptic‐scale
weather and oceanic patterns. The opening takes place
over a few days. Obviously, cracks and the subsequent
possible formation of leads depend on the mechanical
properties of the pack ice. They are more likely to occur
when ice is relatively thin (up to the stage of FY thin and
medium ice as defined in Table 2.4).
It should be noted that while a polynya is also an open-
ing in the grand regional ice cover, it is not considered an
ice surface feature. That is because polynyas remain open
since they are linked to long‐term mechanisms of either
warm air circulation from the land or warm upwelling
water current from the ocean. Obviously, polynyas are
much more significant than leads in terms of heat and
moisture fluxes to the cold atmosphere as well as being a
habitat for several marine animals.
In the central Arctic, leads cover 1%-2% of the surface
area in winter and a somewhat higher percentage during
the summer. The impact of leads on the ice cover is differ-
ent in winter than in summer. In winter, the open water in
in SAR images that represent failure zones where shear
and divergence strain is concentrated. They may contain
open water, new ice, rafted ice, or ridges. They are created
by convergence, divergence, shear or a combination of
these processes. Nearly all deformation forms of the ice
cover are localized along these linear features.
Lindsay
and Stern
[2003] show an illustrative figure of the ice
deformation produced from the RGPS, which builds on
the ice motion product (Figure 9.6). The figure is a map
of the total deformation rate, calculated for all cells of a
Radarsat scene of the Arctic Ocean north of the Beaufort
Sea at the end of May 1998. The 10% of the cells with the
largest total deformation rate are shown in black. The
concentration of high deformation indicates quasi‐steady
LKFs. They probably delineate ridges and rigid plates in
some regions. The large area with no data in the Beaufort
Sea (bottom right of the figure) is caused by absence of
the ice cells at the time of initialization of the motion
field in January 1998.
A correlation between the numbers of filaments (ridge‐
like features) observed in SAR images and the average
ice thickness in the western Arctic is shown in
Melling
[1998]. Identification of sea ice ridges using ASAR data
along with other Earth observation sensors (Cryosat‐2,
COSMOS‐Skymed, Landsat, and Quickbird) is presented
in a report published by the Centre for Cold Ocean