Geology Reference
In-Depth Information
ice or snow‐covered ice) and wet slush produce the high-
est and lowest emissivity, respectively. Emissivity from
the horizontally polarized emission exhibit more varia-
bility than vertically polarized observations, particularly
from wet surfaces.
Grenfell et al
. [1998] observed the
same at 85 GHz horizontal polarization and attributed it
to the increased volume scattering near the top surface
of the snow.
Markus and Dokken
[2002] also found that
the emissivity from the 19 GHz horizontal channel was
particularly sensitive to inhomogeneities such as a bur-
ied crust layer within the snow. The data in Figure 8.36
were obtained for snow depths between 5 and 10 cm and
with the surface temperature between −11 and +2°C.
These ranges are associated with different processes and
surface conditions operating at the same scale as of the
wavelength of the radiation. The figure shows that emis-
sivity for different surface conditions of thin ice can be
grouped into two radiometrically distinguished catego-
ries, the first includes wet slush and wet bare‐ice surface
and the second includes wet snow, dry snow, and dry
bare ice. The second is associated with higher values of
emissivity. Refrozen slush surface appears to fall between
these two categories.
Surface roughness is another factor that influences the
emissivity. As a rule of thumb, when the roughness scale
matches the wavelength of the radiation (i.e., the surface
appears rough to the radiation) more scattering takes
place and hence the surface emits less energy.
Grenfell
et al
. [1988] studied this effect using artificial sea ice
grown in the outdoor artificial ice tank in the CRELL. To
resemble a rubble ice field, the 15 cm thick ice surface was
covered with a layer of semicircular ice disks of about 2 cm
thick and 5 cm in diameter. The influence of this layer on
the emissivity is presented in Figure 8.37, which shows
results before and immediately after the layer was added
1. 0
0.9
0.8
H polarization
V polarization
0.7
Open water (theory)
0.6
0.5
0.6
0.7
0.8
0.9
1. 0
Emissivity 37 GHz
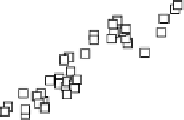
Figure 8.35
Correlation between emissivity of MY ice at 18
and 37 GHz, measured at an incidence angle of 50° over more
than 200 sites in the Arctic. Two clusters can be seen at the two
sides of the vertical line. The clusters separate measurements
from hummock ice (left) and melt pond ice (right) [
Grenfell
,
1992, Figure 5, with permission from AGU].
1. 1
1. 0
0.9
0.8
0.7
0.6
0.5
0.4
19V
37V
85V
19H
37H
85H
0.3
0.2
Water
et
slush
Wet ice
srfc.
Refrozen
slush
Wet
snow
Dry
snow
Dry ice
srfc.
Figure 8.36
Emissivity of OW and different surface conditions of thin ice for three frequencies and two polariza-
tion observations. The emissivity was calculated from measurements of brightness temperature of simulated sea
ice grown in an outdoor tank in the National Research Council in Ottawa, Canada [
Shokr et al.
, 2009].


