Geology Reference
In-Depth Information
400-550 nm. A remarkable observation in Figure 8.23
is the significant increase of albedo when 5-10 mm of
snow is overlain on 140 cm FY ice surface. The broad-
band albedo increases from 0.49 to 0.81. In the context of
albedo measurements,
Brandt et al
. [2005] suggested that
any snow thickness greater than 1 cm should be classified
as “thick snow.” Measurements of albedo from snow‐
covered FY ice shown in the figure are adequately repro-
duced by the delta‐Eddington radiative transfer model
[
Wiscombe and Warren
, 1980] for the observed snow grain
radius of 50
μ
m (shown also in the figure).
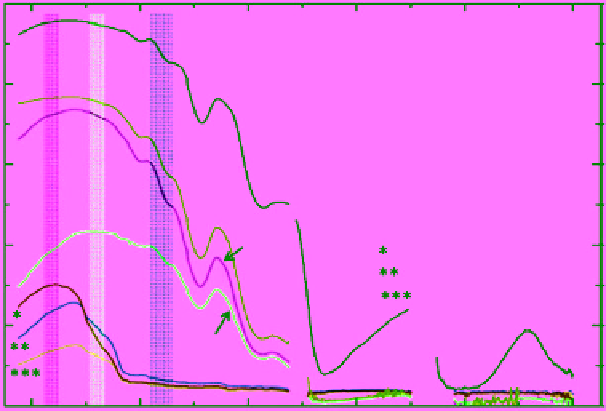
Spectral albedo in the range from 350 to 2500 nm was
measured in the Chukchi Sea near Barrow, Alaska, in the
spring and early summer of 2004 from FYI with a variety
of surface conditions [
Tschudi et al
., 2008]. Measurements
started in April when the snow was dry and continued
through the summer to include different types of ponds
on the ice surface. The purpose was to use these measure-
ments to develop an algorithm to determine the daily melt
pond cover over sea ice in the Beaufort/Chukchi Sea region
in the summer using the surface reflectance product from
MODIS. Figure 8.24 depicts the spectral albedo of a few
ice types observed during the campaign. MODIS spectral
bands 3, 1, and 2 are marked by the vertical bars. Compared
to Figure 8.23, this figure adds information about dry and
wet snow as well as melt pond under different conditions.
The difference between dry snow and melting snow albedo
is significant but albedo from melting snow and bare white
ice are similar (white ice is defined in this study as ice that
has surface scattering layer of typically a few centimeters
thick consisted of small fragments of deteriorated ice). All
types of ponds return similar low albedo values. Note
the sharp drop in albedo from all ice surfaces in the NIR
region. Albedo from the spectral bands of MODIS is used
in the same study [
Tschudi et al
., 2008] to identify fractions
of different surfaces in a heterogeneous footprint. The
technique to estimate melt pond coverage involves solving
a set of linear equations similar to equation (8.12) but with
reflectance instead of brightness temperature in the left‐
hand side of the equations and the concentrations in the
right‐hand side representing four surfaces: melt ponds,
OW, snow‐covered ice, and white ice.
It is true that ice has a lower spectral albedo in the NIR
wavelengths compared to VIS wavelengths, but clouds
absorb more radiation in the NIR. The net effect is that the
broadband albedo of sea ice (either bare surface or snow‐
covered) is higher under cloudy skies than under clear skies.
Grenfell and Perovich
[1984] reported albedo values of sea ice
under cloudy skies at about 0.05 higher than the correspond-
ing values under clear skies. The effect of cloud cover on
the spectral composition of the downwelling radiation flux
was previously studied by
Grenfell and Maykut
[1977]. They
measured clear‐sky total albedo values of 0.63 and 0.22 for
melting old Arctic ice with snow cover and with mature melt
ponds, respectively. Their measurements of the equivalent
values under cloudy skies were 0.77 and 0.29, respectively.
Modeled albedo allows for derivation and under-
standing of its spectral behavior over the entire optical
range. Several models have been developed with different
degrees of sophistication.
Grenfell
[1983] and
Grenfell and
Perovich
[1986] used a multistream, single‐layer model.
This model was later improved by
Grenfell
[1991] to
1. 0
0.8
0.6
Bare
white ice
0.4
Deep blue pond
Blue-green pond
Dark pond
0.2
Dirty
bare ice
0.0
400
800
1200 1600
Wavelength (nm)
2000
2400
Figure 8.24
Spectral albedo of different surfaces of FY ice measured in the Chukchi Sea near Barrow, Alaska, in
the spring of 2004. MODIS spectral bands 3, 1, and 2 are shown by the vertical bars (from left to right) [
Tschudi
et al
., 2008, Fig. 2, with permission from Elsevier].