Geology Reference
In-Depth Information
Am5h-o-Arc07-261-261
Qu5h-o-Arc07-261-261
2007-9-18
AMSR HIRZ
QuickScot
2007-9-18
QuikSCAT
σ
o
hh
AMSR-E
Tb
36
h
300 K
-5 dB
-10 dB
250 K
-15 dB
200 K
QuikScot L1B
hh
18/9/2007
AMSR-E
36.5 GHz-H
18/9/2007
-20 dB
150 K
-25 dB
100 K
-30 dB
Surface Temperature
2007-09-18
75N
256K
258K
80N
260K
85N
262K
264K
266K
268K
85N
270K
272K
80N
274K
75N
276K
278K
280K
70N
Surface temperature
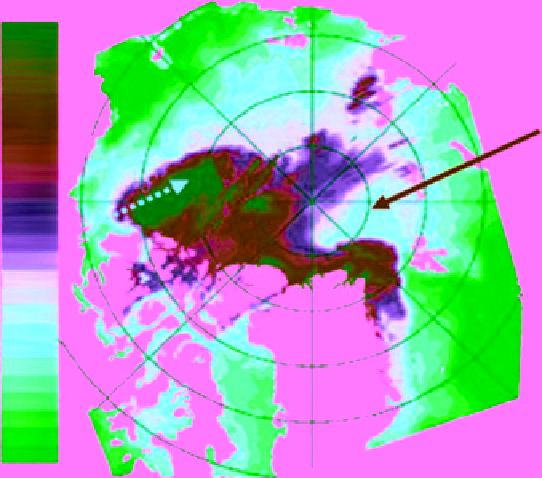
Figure 7.46
Daily average mosaics of AMSR‐E
T
b
,36
h
and QuikSCAT over the Arctic basin for 18 September
2007 (top panel) and the coincident surface temperature map obtained using the weather model GEM used by
the Canadian Meteorological Center (bottom). Anomalies in the remote sensing signatures of the MY ice image
are marked by the solid arrows and they correspond to higher air temperature in the temperature map. The dotted
arrow indicates an area of very cold temperature (below −20 °C). [
Shokr and Agnew
, 2013]. (For color detail,
please see color plate section).
Since wet snow is a lossy medium to microwave fre-
quencies, the dielectric constant increases (both its real
and imaginary parts) as wetness increases. For radar
observations, the increase of the real part (permittivity)
causes the surface scattering to increase while the increase
in the imaginary part (loss) causes the volume scattering
to decrease due to increasing absorption (details on the
permittivity and loss are given in section 3.6). The