Geology Reference
In-Depth Information
Coherency and Polarization of Radar Signals
Radar
pulses generated by SAR are coherent, meaning that they
have the same phase. This feature allows measuring the
phase of the return signal with respect to the “reference”
phase of the transmitted signal. The phase measurement
by radar sensors is part of the information that can be
used to define the type, geometric characteristics, and
elevation of the observed surface. Estimate of the eleva-
tion of the imaged surface is the essence of SAR inter-
ferometry technology. Since no applications of this
technology exist in the field of sea ice, it will not be pur-
sued in the following discussion. As mentioned, the phase
information measured by SAR is implied in the SLC
acquisition mode. Polarimetric data are available in
this mode only. Therefore, the main use of the phase
information in sea ice applications is through the utiliza-
tion of the polarimetric data, as will be explained in the
next section.
In addition to their coherency, the transmitted radar
pulses are also polarized. As mentioned in section 7.3.1, a
polarized EM wave has a predictable alignment of its
electric field vector as it propagates (i.e., it may prescribe
oscillations in a fixed plane or in a prescribed time varying
plane). Upon scattering from the observed surface, the
radar signal often exhibits a change of polarization. The
received signal may be partially polarized with a degree
of polarization determined from equation (7.3). This
constitutes part of the information that can be used
to identify the surface. The SAR antenna can be designed
to receive the component of the backscatter in the same
polarization as of the transmitted pulses and/or in the
orthogonal polarization plane. The received signal is,
therefore, denoted by a pair of symbols, the first refers to
the polarization of the transmitted signal and the second
to the polarization of the received signal. Therefore, HH
means that the detected signal is from horizontally polar-
ized transmitted wave and horizontally polarized received
wave. HH and VV are called co‐polarization signals and
HV and VH are called cross‐polarization signals. The
reciprocity theorem dictates that the backscatter in HV
and VH are equal.
Interpretation of the radar images in terms of their
polarization requires understanding of how the vertical
and horizontal polarizations differ in their interactions
with the surface and what causes the depolarization of the
scattered signal. Vertical and horizontal polarization sig-
nals interact differently with vertically oriented surface
structures. This is obvious in the case of vertically oriented
plants in agricultural and forest fields and to some extent
in vertically oriented rubble and ridges of ice surface.
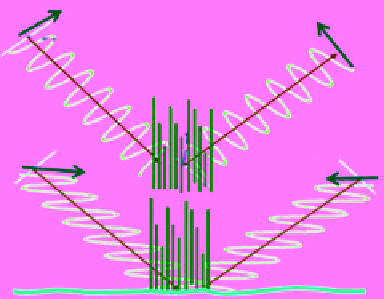
Figure 7.31 is a schematic diagram that illustrates this
interaction. As vertical scattering elements act as dipoles,
vertically polarized signals will interact strongly with them
to produce relatively high backscatter in the co‐polarization
V
V
H
H
Figure 7.31
Interaction of vertical and horizontal polarization
signal with vertically oriented objects. The vertical polarization
interacts with these objects, but the horizontal polarization does
not; instead it is scattered off the underlying ground surface.
(VV). Horizontally polarized signals, on the other hand,
do not interact with vertical structures as much as they do
with the underlying surface, resulting in low backscatter in
the co‐polarization (HH). In both cases the cross polariza-
tion is low. The difference between HH and VV scattering
is, therefore, used to identify objects that stand vertically.
This is particularly useful in agricultural applications.
Information about the canopy is usually embedded in the
vertically polarized (VV) radar backscatter while informa-
tion about the underlying soil can be retrieved from the
horizontally polarized (HH) backscatter.
This feature is also manifested in backscatter from rough
ocean surface since
0
is found to be considerably higher
vv
than
0
. Figure 7.32 demonstrates this effect by compar-
hh
ing
0
from
Radarsat‐1 (both satellites operate at C‐band). It should be
noted, however, that the radar viewing directions between
the two images in the figure are opposite (ascending and
descending). These images were used in
ESA
[1998] to
demonstrate the potential use of the alternate polarization
mode (VV and HH) of ASAR onboard ENVISAT.
The basic physical process responsible for the depo-
larization (high cross‐polarization backscatter) of the
scattered signal is the multiple bouncing (scattering) of
the signal. This process can be triggered by surface struc-
ture/topography, or the presence of numerous volume‐
scattering elements. For sea ice, the manifestation of the
surface structure is the ridge formation at FY ice surface
and volume scattering in the bubbly‐rich layer in MY ice.
In both cases relatively high cross polarization is expected.
However, this depends on the wavelength and viewing
geometry of the signal in relation to the dimensions and
the tilt of the scattering elements. For example, less vol-
ume scattering from MY ice is observed from the L‐band
than C‐band because the wavelength of the former is
0
of rough water from ERS‐2 SAR against
vv
hh