Geology Reference
In-Depth Information
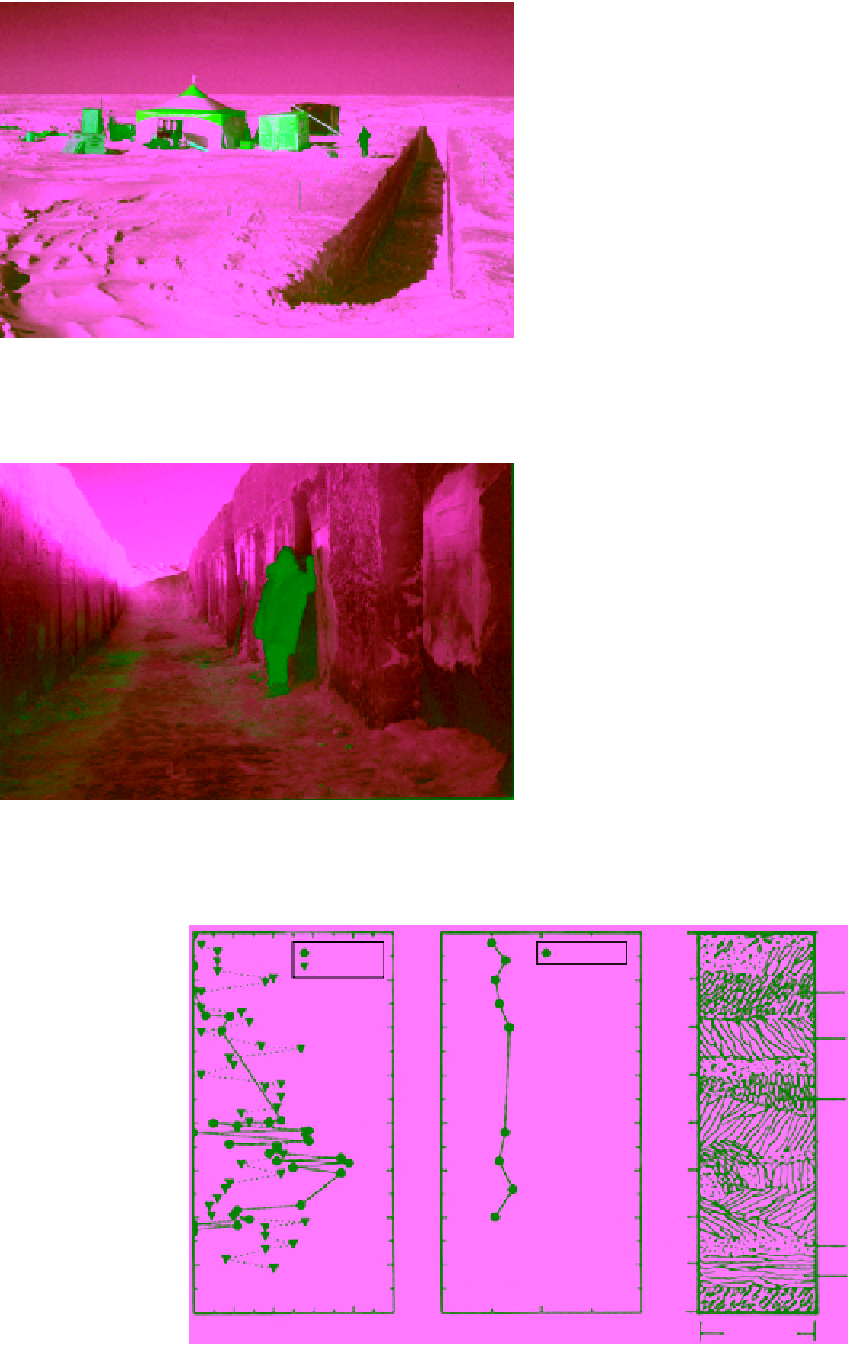
revealed the outlines of ice blocks that could be seen at
many places in the walls. They indicated that the ridging
occurred when the thickness of the sea ice cover was
about 0.5 m thick. The ice showed characteristics typical
for old, consolidated, ridged rubble field of sea ice exam-
ined in Mould Bay [
Sinha
, 1987a]. Although the density
varied only slightly between 875 and 886 kg/m
3
(Figure 5.48), the salinity varied significantly with depth
and location [
Sinha
, 1991]. Core 1 was situated approxi-
mately 20 m away from core 2. ln general, the ice salinity
increased from zero at the surface level to about 3 ppt (‰)
at a depth of 4 m.
5.2.4. Radarsat Images of Glaciers and Arctic
Ice Islands
Figure 5.46
Medium‐scale indentation test site showing the
65 m long, 3 m wide, and 3 m deep trench in MY rubble field
of Hobson's Choice ice island.
This chapter started with the Mould Bay projects that
began in 1981 primarily to provide vital information
necessary for the Radarsat project. It is, therefore, appro-
priate to end the chapter with a brief introduction to the
results obtained with the satellites. A large photograph‐
like SAR image of the entire continent of Antarctica
hangs on a wall of the Canada Aviation Museum in
Ottawa. This composite image, illustrated in Figure 5.49,
is a digital mosaic of microwave SAR surface images
recorded on and around 14 September 1997 by Canada's
first Earth Observation satellite Radarsat‐1. This satel-
lite was launched on 4 November, 1995 and provided
excellent images of Earth for almost 18 years until 29
March, 2013.
In order to capture the SAR images of the Antarctica,
the Radarsat‐1 satellite was rotated in orbit, so that its
SAR antenna looked south toward Antarctica. This per-
mitted the first high‐resolution mapping of the entire
Figure 5.47
Trench wall in MY sea ice rubble field attached
to Hobson's Choice ice island exhibiting a few ground and
polished test surfaces.
0.0
Core - 1
Core - 2
Core - 1
0.5
Oriented
frazil
1. 0
Columnar
1. 5
Oriented
frazil
2.0
2.5
3.0
Granular
Columnar
3.5
4.0
0
123
Salinity, ‰
45850
900
950
100 mm
Density, kg/m
3
Core-1
Figure 5.48
Salinity, density, and structure of Hobson's Choice ice island MY rubble‐field ice [
Sinha
, 1991].