Geology Reference
In-Depth Information
Z
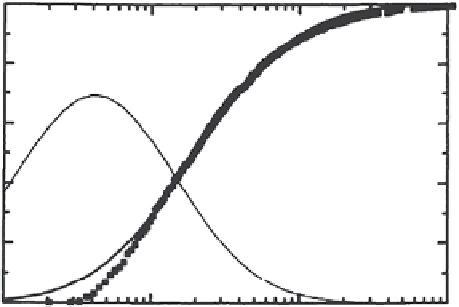
=19 cm
1. 0
50
0.8
40
0.6
30
0.4
20
0.2
10
0.0
0
1E-3
0.01
0.1
1
Area (mm
2
)
Figure 4.55
Horizontal thin sections of columnar young ice at 190 mm depth after (
left
) segmentations and (
right
)
the distributions of the area of brine inclusions. The solid squares are the points on the cumulative distribution,
while the best fit curve is shown as a solid line. Also shown separately is the probability density function of the
area. The scale is provided by the ruler with marking in millimeter at the top of the digitized photograph [
Perovich
and Gow,
1996
,
Figure 2, with permission from AGU].
led to different results of brine inclusion dimensions and
their number density. The brine inclusion dimensions were
found to range from less than 0.01 mm to nearly 10 mm,
with number densities averaging around 24 brine pockets
per mm
3
. This is an order of magnitude larger than the
average brine pocket dimension of 1.0 mm, and the num-
ber densities range from 1.0 to 4.5 per mm
3
as reported in
Perovich and Gow
[1996].
Light et al.
[2003] estimated two
more geometrical parameters of brine inclusions: the num-
ber density per unit volume
N
and the aspect ratio of the
brine inclusion shape
γ
. They found that the data of both
parameters can be well represented by the following power
law in terms of the major length of the brine inclusion
l
:
could be obtained by complementing the data obtained
from both horizontal and vertical thin sections. They
found, for example, that brine inclusion shapes ranged
from nearly spherical to be elongated with vertical extent
exceeding 15 times the diameter.
4.5.3. Geometric Characteristics of Air Bubbles
Air bubbles in MY ice are the main scattering elements
of microwave signals when their characteristic dimen-
sions match the wavelength of the incident or the emitted
signal (ranging from a few millimeters to a few centime-
ters). Nevertheless, the data on the geometrical character-
istics of the bubbles are scarce. Studies on air bubbles in
FY ice were boosted because of the interest in the optical
properties of ice. That, of course, preceded the interest in
microwave interaction with ice. For example,
Grenfell
[1983] determined the bubble diameter, size, and number
density from thick sections (5 mm thick) of sea ice in a
lead in Beaufort Sea in October 1974 using a 20 power
eyepiece with a 0.1 mm reticle. The study concluded that
air bubbles occupied a range from 0.1 to 2 mm in diame-
ter, and the size distribution could be represented by the
log of the number of particles per cubic millimeter
N
(
r
)
in the interval
r
to (
r
+
dr
). This parameter can be deter-
mined using the following power law:
Nl
028
.
l
196
.
(4.8)
This equation is valid for the range 0.01 ≤
l
≤ 8 mm.
Integration of the above equation between these two lim-
its of
l
yields the number density of 24 inclusions per mm
3
as mentioned above. The brine inclusion shape is given by
10 3
067
.
l
.
l
(4.9)
The equation applies for 1 ≤
γ
≤ 70 and
l
> 0.03 mm.
Most of the data on brine inclusion geometry were
obtained from horizontal or vertical thin sections [e.g.,
Perovich and Gow,
1991, 1996;
Eicken,
1993]. This restricts
the retrieved information on the inclusion's geometry to
cross sections and masks the three‐dimensional nature of
the microstructure.
Cole and Shapiro
[1998] demonstrated
that additional information about ice microstructure
124
.
Nrdr r r
(4.10)
where
N
0
is a constant equal to 0.007.