Geology Reference
In-Depth Information
(a)
(b)
0
10 mm
10 mm
(c)
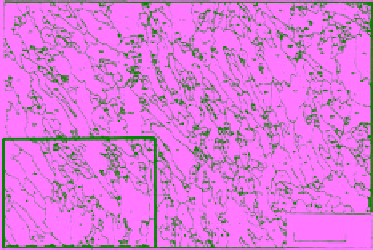
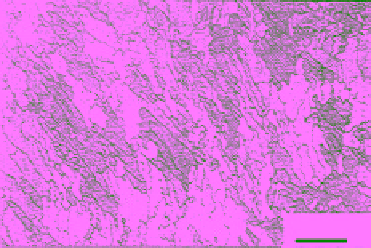
Figure 4.44
(a) Digital image of a horizontal thin section of columnar‐grained, S3‐type FY sea ice from Frederick
Hyde Fjord, northern Greenland, at a depth of 130 mm. (b) Delineated grains and subgrains in binary image with
labeled object numbers and major and minor axes are shown and (c) enlargement of the boxed area. [adapted
from
Johnston and Sinha,
1995].
software package has to be used to identify properties of
grains and subgrains. The software determines the exact
number of pixels in each grain/subgrain as well as a few
other parameters such as the length of major and minor
axes, ferret diameter, shape factor, compactness, perime-
ter, and center of mass binary. Major axis length is auto-
matically determined by searching all of the border pixels
of the object and selecting the two pixels that were sepa-
rated by the furthest distance (Figure 4.44c). Once the
major axis is defined, the minor axis is determined as the
line drawn perpendicular to the major axis, which joins
the two boundary points that are set furthest apart. The
software can tabulate the exact number of grains and sub-
grains. The area of each object is calculated by summing
the number of pixels enclosed within its perimeter. Prior
to using a digital image of a thin section, the actual
dimensional aspects of the image are calibrated manually
by specifying the intermediate spacing between any two
points within the frame of reference. The area can then be
determined in an appropriate area unit.
The highly oriented nature of the S3‐type sea ice is
made apparent, especially with respect to the minor and
major axes (Figure 4.44c). Close inspection of the minor
axis of subgrains provides further evidence of the geo-
metric selection process with horizontally oriented
c
axis. The minor axis of the subgrains tends to be parallel
to the
c
axis.
Figure 4.45 presents a series of histogram characteriz-
ing the grains and subgrains in Figure 4.44. In this case,
at a depth of 130 mm, the mean area of subgrains within
a grain is approximately 60% less than the area of the
overall grain. Minor and major axes lengths of the sub-
grains are 20%-30% smaller than those of the grains. The
length of the minor axis of subgrains provides an indi-
cation of the brine layer spacing. The analysis of minor
axis length for FY sea ice from Frederick Hyde Fjord
shows that the size of individual subgrains ranges from
about 0.1 to 2.5 mm. This is within the wavelength of the
microwave X‐band.
There seems to be correlations between the lengths of
the major and minor axes of the grains/subgrains. These
are shown in Figure 4.46 for the same section in Figure 4.44.
The equation most representative of the scattered data
is a power law function with a constant of proportionality
ranging between 2.3 and 2.8 and an exponent of 0.9. A
regression coefficient,
R
2
, value near 0 indicates a poor fit,
and a value close to 1 indicates a good fit. As can be seen,
the correlation between the minor and major axis lengths
for individual grains may be acceptable with
R
2
value of
0.74. But the corresponding correlation (
R
2
= 0.54) for the