Geology Reference
In-Depth Information
Particle contact ratio = 0.1
Particle contact ratio = 0.2
1. 0
1. 0
0.8
0.8
0.6
0.6
0.4
0.4
0.2
0.2
0
0
100
200
300
Density (kg/m
3
)
400
500
600
100
200
300
400
500
600
Density (kg/m
3
)
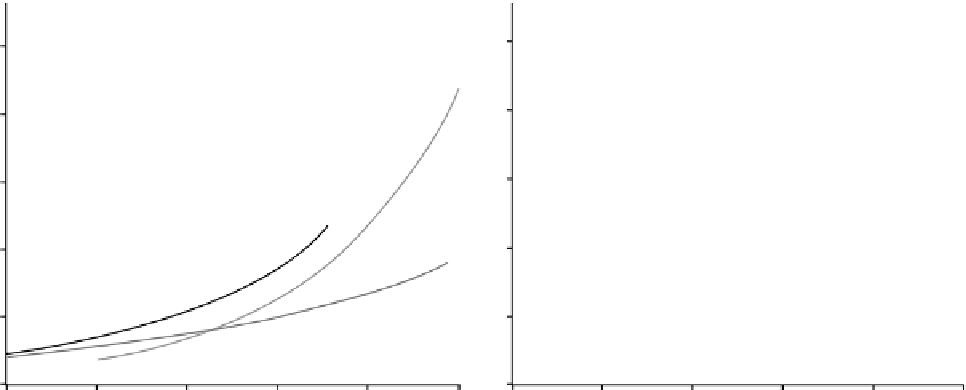
Figure 3.23
Variation of effective thermal conductivity of snow with snow density computed from a one‐
dimensional heat transfer model suggested by
Satyawali and Singh
[2008] for three shapes of ice grain inclusions
in the snow (spherical, cylindrical, and cubical) and two characteristic ratios of grain size to grain spacing. Snow
temperature of −5 °C was used in the calculations. Empirical results from the model by
Strum et al.
[1997] are
also included [
Satyawali and Singh,
2008].
0.5
Wetted and refrozen
Slabs of increasing hardness
Slabs going to depth hoar
0.4
New to fine grained
0.3
Increasing hoar metamorphism
0.2
0.1
2
4
6 8 10
Snow code (Table 3.6)
12
14
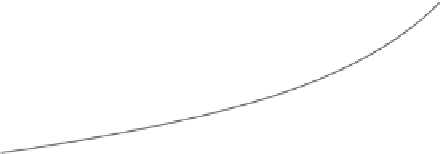
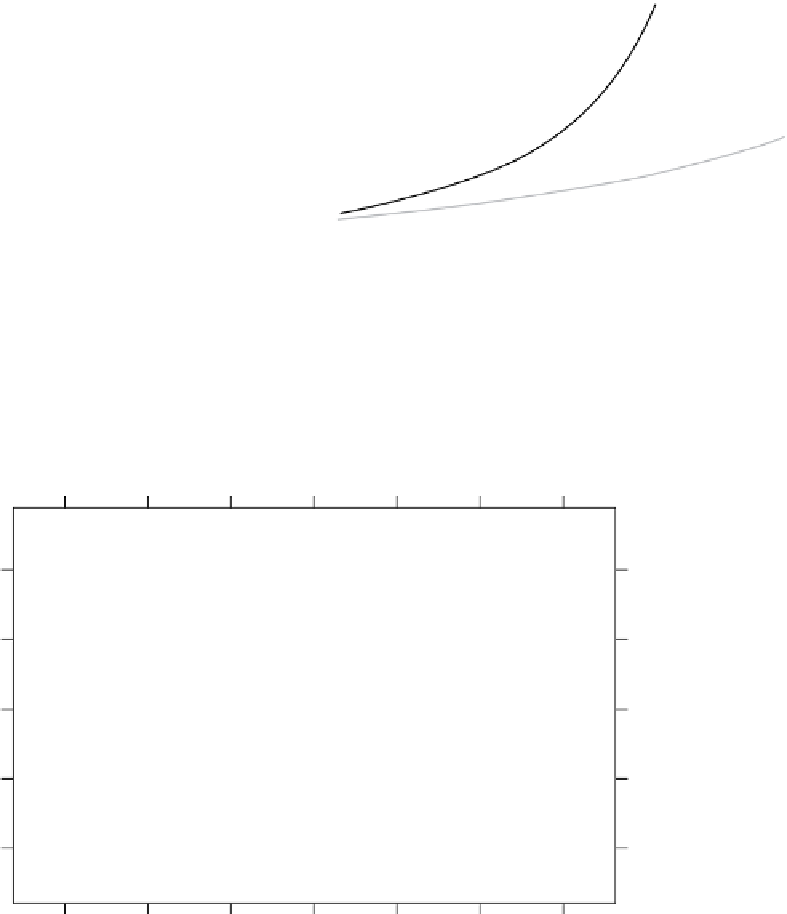
Figure 3.24
Trajectory of thermal conductivity of snow over sea ice, measured during SHEBA program in the
Beaufort Sea, winter of 1997. Snow code at the horizontal axis is presented in Table 3.6. Symbols are explained
in Figure 3.21 (adapted from
Sturm et al.
[2002], Figure 5, with permission from AGU).
0.29 W/m · K for ubiquitous wind slab. The study presented
a trajectory of thermal conductivity of the snow as it
evolves through different phases in winter (Figure 3.24).
The code for snow types is given in Table 3.6. New snow
has low density and therefore low thermal conductivity. As
snow settles and becomes more compacted,
K
s
increases.
If the fine‐grained snow is transported by the wind,
grains will be broken and their size is further reduced.
Consequently, when drifting snow settles, a wind slab will
form through sintering, producing more compacted snow
with higher
K
s
values. Following that, a steep temperature
gradient within the snow depth will cause the slab to