Geology Reference
In-Depth Information
measurements show the continuity of the salinity across
the ice‐water interface. They measured a mean salinity of
26‰ when seawater was included in the sample and 18.9‰
from a drained ice sample. The continuity of the salinity
across the ice‐water interface was also concluded by
Cox
and Weeks
[1975]. Salinity measurements of grease ice are
presented in
Smedsrud and Skogseth
[2006]. Only a few
scattered points were measured, but the work presents the
first attempt to characterize grease ice, which is often
found in leads and polynyas in polar winters. Grease ice
has usually a brine coating on top of frazil crystals.
S3 type (Table 4.1) FY columnar-grained and vertically
oriented S5 type frazil FY ice, and S3 type MY hummock
ice in Mould Bay in the Canadian western Arctic were
investigated in the field in 1981 by
Sinha
[1984b, 1986] (see
also Chapter 5). He also examined the effect of density on
compressive strength of these three types of ice at −10 °C.
The densities were measured by weighing 'machined' pris-
moidal specimens with dimensions, 30 × 30 × 150mm
(small) and 50 × 100 × 250mm (large). The density of S3
and S5 type of FY ice was found to be between 890 and
920 kg/m
3
and did not vary much with depth, similar to the
1977-79 observations of
Sinha and Nakawo
[1981] for ice
in Eclipse Sound in Baffin Island. However, it increased
significantly for the MY hummock ice, from the low near
surface value of 720 to high value of 910 kg/m
3
at a depth
of 0.5 m. Almost exactly the same vertical density profile
was also noted in second-year (S3 type) ice in Mould bay
in 1983 [
Sinha,
1985b] as described in Section 5.1 and illus-
trated in Figure 5.18. It should be pointed out here that
the procedures used for density measurements are ideal for
porous ice. Extremely accurate immersion technique,
developed earlier at NRC by
Nakawo
[1980, 1983] is not
possible for materials with open and interlinked pores.
Almost ten years after the 1981 Mould Bay observa-
tions, an opportunity came in 1992 for Sinha to join Shokr
(two authors of this topic) to investigate thoroughly and
statistically significant investigations of the physical prop-
erties, relevant to microwave scattering, of FY and MY ice
in Lancaster Sound, near Resolute, in the Canadian cen-
tral Arctic [
Shokr and Sinha
, 1994, 1995]. Vertical profiles
of temperature in cores (immediately after extraction),
density and salinity were obtained for 15 cores of FY ice
and equal number of MY hummock and melt pond ice.
Temperature, salinity and density profiles in the top 0.40 m
of two cores representing FY ice and MY hummock ice
are shown in Figure 3.16. Unlike the density of FY ice and
MY melt-pond ice, the density of hummock ice is notice-
ably low (around 700 kg/m
3
) near the surface and increases
with depth. The most important factor in determining the
density in MY ice is the air bubbles contents [
Schwerdtfeger,
1963;
Weeks,
1976;
Sinha,
1984b;
Wadhams,
2000].
3.3. densiTy of firsT‐year and mulTiyear ice
Most liquids shrink as their temperature approach
the freezing point because the molecules tend to move
slower. Water and ice are exceptions because of the
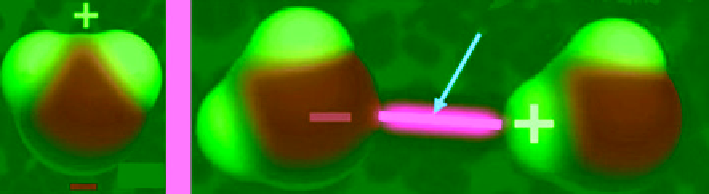
polar nature of their molecule, as shown in Figure 3.15.
Positive and negative charges are not evenly distributed
across the molecule so the molecule forms a dipole. This
leads to a special force and pattern of attractions between
molecules, called hydrogen bonding. It is this bonding that
gives water an unusual behavior when freezing. When
water is cooled to near freezing temperature, hydrogen
bonding causes molecules to rearrange into lattice structure
with “open gaps” within the lattice. This causes decrease of
water density below its maximum density of 999.97 kg/m
3
at 4 °C. Below this temperature the water becomes less
dense as the molecules begin to form hexagonal lattice.
When water freezes, the open solid structure of ice contin-
ues to have larger gaps, causing ice to be less dense than
liquid water. The density of pure ice is 917.6 kg/m
3
at 0 °C,
whereas water has a density of 999.87 kg/m
3
at the same
temperature. Density of ice increases slightly with decreas-
ing temperature, reaching 934.0 kg/m
3
at −180 °C.
Ice in nature is polycrystalline. Classification of natural
ice is described in Chapter 4 and various types are listed in
Table 4.1. Due to high thermal states, physical properties
of ice are very sensitive to porosity (hence density) and the
rate of deformation at a given temperature. The strain- and
stress-rate sensitivity of uniaxial compressive strength of
(a)
(b)
Hydrogen bond
H
H
O
Figure 3.15
Polar structure of a water molecule with the two hydrogen atoms and one oxygen atom is shown in (a).
The hydrogen bond that attracts water molecules together is illustrated in (b). (For color detail, please see color
plate section).