Geology Reference
In-Depth Information
on the slope of the curve). Similar to the growth rate, the
stable salinity profile also exhibits a record related to the
major weather changes. The low salinity of 4‰ at a depth
of 10-30 cm seems to be related to the slow growth rate
corresponding to the warm period in November. The
higher salinity of 7.5
‰
recorded at a depth of 40-70 cm
correlates well with the higher growth rate initiated by the
cold period in December. Further correspondence can be
seen as the relatively lower salinities at a depth from 70 to
80 cm correlate well with the warmer periods at the end of
December. The same observation applies to the low salin-
ity between 110 and 120 cm depth (i.e., the salinity profile
of 17 March or 14 April in Figure 3.7), whereas the com-
paratively higher salinity developed at 80-100 cm relates
well with the colder period in the first 3 weeks of January.
A nondestructive method for measuring the salinity
and solid ice fraction in sea ice was developed by
Notz
et al.
[2005] using an instrument that measures electrical
impedance. It was used in field and laboratory measure-
ments. It consists of a series of thin wire pairs inserted at
different depths in the ice. Each wire is 14 cm long, so any
point salinity measurement is averaged along this length.
The solid ice fraction and the local bulk salinity can be
determined from the measured electrical impedance
between any pair of wires and the temperature at the
same depth. The instrument allows salinity measure-
ments from very thin ice and mush ice layers, which can-
not otherwise be measured from ice cores because of the
severe brine drainage during core extraction.
Notz and Worster
[2008] used this instrument to meas-
ure the salinity evolution of young sea ice in the Arctic.
The approach involved making a 1 × 1 m
2
hole into 20 cm
thick fast ice cover and measuring the salinity and tem-
perature of the new ice formed in the hole over a course
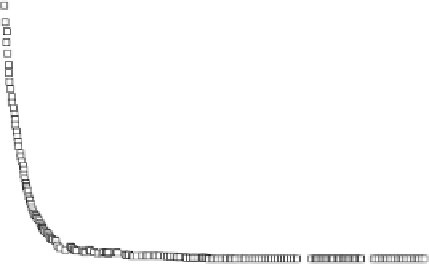
of a few days. In this unique data set, the authors show
the rapid loss of salt from the onset of ice formation at
the ice‐water interface until the salinity stabilized after a
few hours or tens of hours in the case of thin ice
(Figure 3.13). Most of the salt is lost within 24 h when the
ice is ≤15 cm as the salinity drops from 35
‰
to about 4
‰. The rate of drop decreases as the ice thickens (i.e., as
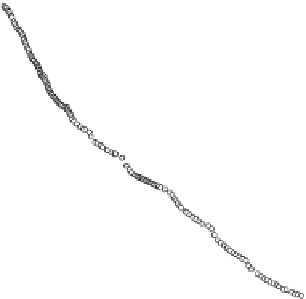
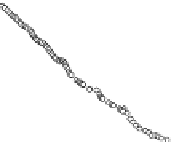
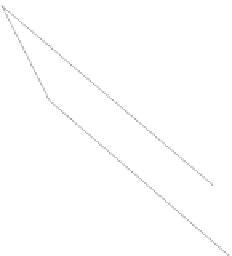
the growth rate is reduced). The authors also determined
the salt flux into the underlying ocean by calculating the
slope of the mean salinity during the growth of the 17 cm
layer of ice. Results from two experiments conducted on
different days are shown in Figure 3.14. In the second
experiment the temperature was lower than that of the
first experiment and the wind was much stronger (gusts at
18 m/s). This led to the formation of frazil ice in the hole,
a condition more comparable to new ice formation in the
open ocean. Figure 3.14 shows the temporal evolution
of the mean bulk salinity. The slopes indicate that in
the initial 24 h, rapid desalination of about 90 g/m
2
· h
took place, but the desalination rate decreased to about
35
0.5 cm
1.75 cm
3.5 cm
5.5 cm
8.0 cm
11.0 cm
15.0 cm
30
25
20
15
10
5
0
0
20
40
Hours since start of the experiment
60
80
100
120
140
Figure 3.13
Temporal evolution of the bulk salinity at various
depths during a field experiment on land‐fast ice in the
Adventfjorden in Svalbard (78°N), measured in March 2005.
[
Notz and Worster,
2008
,
Figure 4, with permission from AGU].
35
30
25
Experiment 2
20
15
Experiment 1
10
5
0
0
20
40
60
80
100 20
140
Hours since start of the experiment
Figure 3.14
Temporal evolution of the mean bulk salinity of
the upper 17 cm of the water column as it freezes gradually.
The thin lines are approximate linear fits to the data from which
salinity fluxes into the ocean can be calculated. The two exper-
iments were conducted on ice in the Adventfjorden in Svalbard
(78°N, 23°E). Note that the salinity is presented in PSU, which
is not very different from
‰
. [
Notz and Wroster,
2008
,
Figure
5, with permission from AGU].
40 g/m
2
· h and remained at this rate until 80 h when the
entire length of the instrument was covered by ice.
It is worth mentioning that
Notz and Worster
[2009]
used the same instrument to accurately measure the salin-
ity in the mushy layer of the sea ice, which cannot be
measured from ice cores because of the brine drainage
from the bottom of the core during its extraction. The