Global Positioning System Reference
In-Depth Information
1
2
3
4
5
6
7
8
9
10
11
12
13
14
15
16
17
18
19
20
21
22
23
24
25
26
27
28
29
30
31
32
33
34
35
36
37
38
39
40
41
42
43
44
45
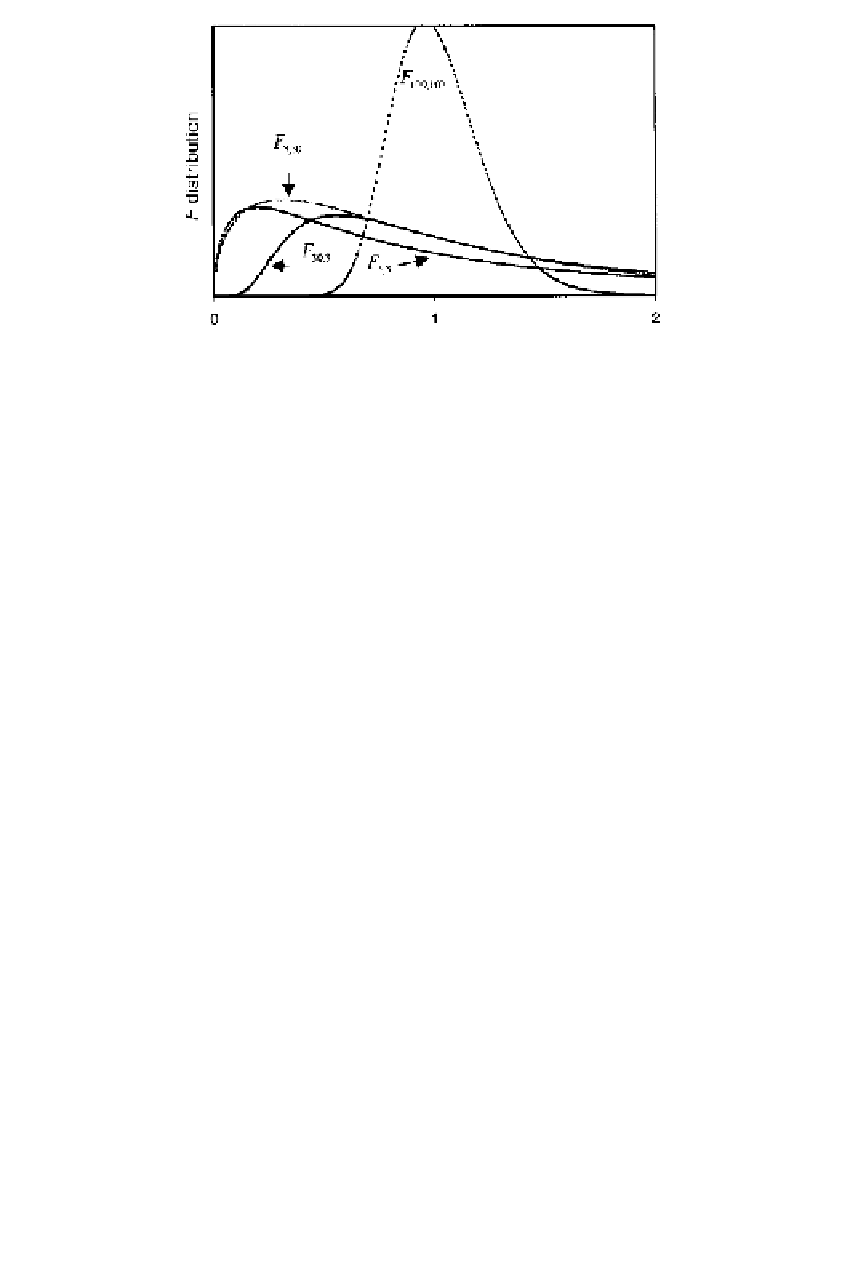
Figure A.5
The F distribution.
[36
This is the
F
distribution with
r
1
and
r
2
degrees of freedom. The mean, or the expected
value, is
Lin
—
0.4
——
Lon
PgE
r
2
r
2
−
E(F
r
1
,r
2
)
=
(A.136)
2
fo
r
r
2
>
2. Care should always be taken to identify the degrees of freedom properly
sin
ce the density function is not symmetric in these variables. See Figure A.5. The
fo
llowing relationship holds:
[36
1
F
r
2
,r
1
,
1
−α
F
r
1
,r
2
,
α
=
(A.137)
The
F
distribution is related to the chi-square and the
t
distributions as follows:
r
r
∼
χ
F
r,
∞
(A.138)
t
r
∼
F
1
,r
(A.139)
r
1
,
If
has a noncentral chi-square distribution with
r
1
degrees of freedom
and a noncentrality parameter
u
˜
∼ χ
λ
, then the function
F
in (A.134) has a noncentral
F
distribution with
r
1
and
r
2
degrees of freedom and noncentrality parameter
λ
λ
. The
mean for the noncentral distribution is
1
r
2
r
2
−
r
1
E(F
r
1
,r
2
,
λ
)
=
+
(A.140)
2
A
.5.2 Distribution of Sums of Variables
The following functions of random variables are required in the derivation of distri-
butions of key random variables in least-squares estimation.