Global Positioning System Reference
In-Depth Information
1
2
3
4
5
6
7
8
9
10
11
12
13
14
15
16
17
18
19
20
21
22
23
24
25
26
27
28
29
30
31
32
33
34
35
36
37
38
39
40
41
42
43
44
45
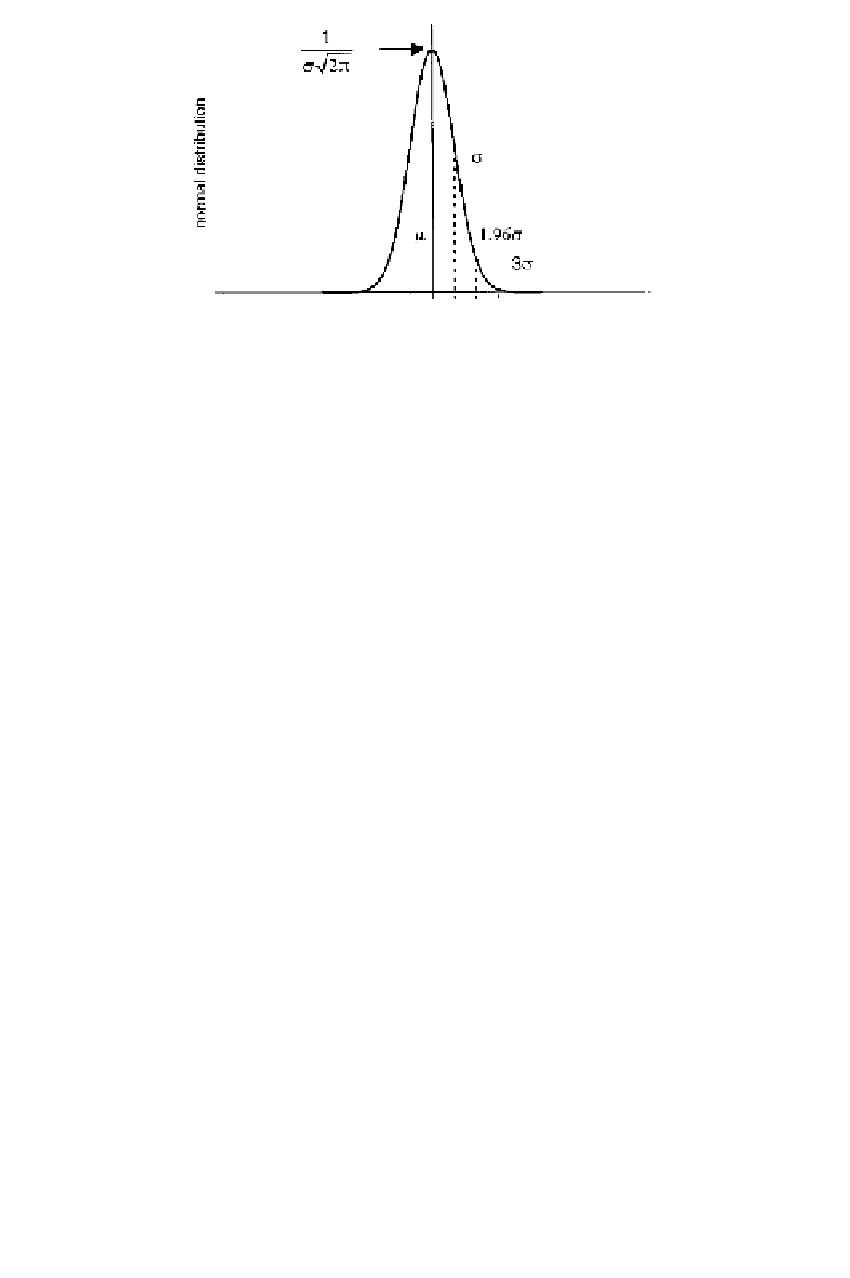
Figure A.3
Normal density function.
[36
x
˜
− µ
σ
w
˜
=
∼
n(
0
,
1
)
(A.128)
Lin
—
0.1
——
Nor
*PgE
has a normal distribution with zero mean and unit variance. The random variable
w
˜
is said to have a standardized normal distribution. The density function for
w
is
˜
1
√
2
e
−
w
2
/
2
f(w)
=
−∞
<w<
∞
(A.129)
π
˜
Th
e probability that the random variable
x
is less than
w
α
is
w
α
[36
P
(
x<w
α
)
˜
=
f(w)dw
(A.130)
0
Table A.1 lists selected values that are frequently quoted. For a normal distribution,
in about 68% of all cases the observations fall within one standard deviation from
the mean, and only every 370th observation deviates from the mean by more than 3
σ
.
Therefore, the 3
value is sometimes taken as the limit to what is regarded as random
error. Any larger deviation from the mean is usually considered a blunder. Statisti-
cally, large errors cannot be avoided, but their occurrence is unlikely. The 3
σ
criteria
is not necessarily applicable in least-squares adjustments because the pertinent ran-
dom variables have multivariate distributions and are correlated, thus reflecting the
geometry of the adjustment. Further details are given in Sections 4.10 and 4.11.
Assume that
σ
r
are two stochastically independent random
variables with unit normal and chi-square distribution, respectively; then the random
variable
w
˜
∼
n(
0
,
1
)
and
v
˜
∼ χ
TA
BLE A.1
Selected Values from the Normal Distribution
x
σ
2
σ
3
σ
0
.
674
σ
1
.
645
σ
1
.
960
σ
N(x)
−
N(
−
x)
0.6827
0.9544
0.9973
0.5
0.90
0.95