Global Positioning System Reference
In-Depth Information
1
2
3
4
5
6
7
8
9
10
11
12
13
14
15
16
17
18
19
20
21
22
23
24
25
26
27
28
29
30
31
32
33
34
35
36
37
38
39
40
41
42
43
44
45
8.4.2 SLC Engineering Survey
A
GPS survey was carried out in 1984 to support construction of the Stanford Linear
Co
llider (SLC) with the objective of achieving millimeter relative positional accuracy
w
ith GPS and combining GPS vector with terrestrial observations (Ruland and Leick,
19
85). Because the network was only 4 km long, the broadcast ephemeris errors as
w
ell as the impact of the troposphere and ionosphere cancel. The position accuracy in
su
ch small networks is limited by the carrier phase measurement accuracy, the phase
ce
nter variation of the receiver antenna, and the multipath. We used the Macrome-
te
r antenna, which is known for its good multipath rejection property and accurate
de
finition of the phase center.
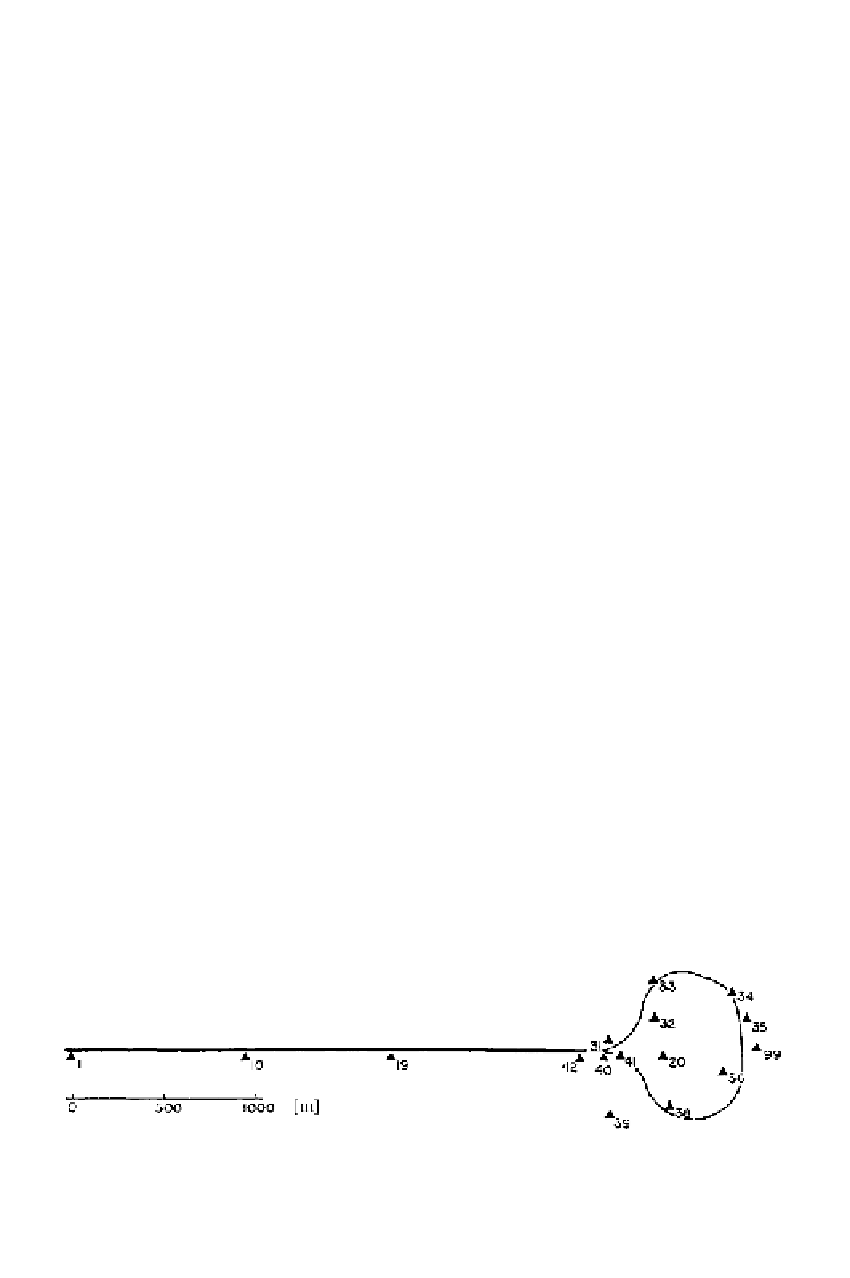
The network is shown in Figure 8.5. Stations 1, 10, 19, and 42 are along the 2-
m
ile-long linear accelerator (linac); the remaining stations of the “loop” were to be
de
termined with respect to these linac stations. The disadvantageous configuration
of
this network, in regard to terrestrial observations such as angles and distances, is
ob
vious. To improve this configuration, one would have to add stations adjacent to the
lin
ac; this would have been costly because of the local topography and construction.
Fo
r GPS positioning such a network configuration is acceptable because the accuracy
of
positioning depends primarily on the satellite configuration and not on the shape
of
the network. Figure 8.6 shows the horizontal ellipses of standard deviation and
th
e satellite visibility plot for the inner constraint vector solution. The dark spot on
th
e visibility plot represents the directions of the semimajor axes of the standard
el
lipsoids.
This survey offered an interesting comparison. For the frequent realignment of
th
e linear accelerator, the linac laser alignment system was installed. This system is
ca
pable of determining positions perpendicular to the axis of the linac to better than
±
[31
Lin
—
0.0
——
Nor
PgE
[31
0
.
1 mm over the total length of 3050 m. A comparison of the linac stations 1, 10,
19
, and 42, as determined from the GPS vector solution with respect to the linac
al
ignment system, was done by means of a transformation. The discrepancies did not
exceed
±
1 mm for any of the four linac stations.
8.4.3 Orange County Densification
Th
e Orange County GPS survey was comprised of more than 7000 vectors linking
20
00 plus stations at about 0.5 mile spacing. With that many vector observations,
it
is beneficial to use graphics to analyze observations, the adjustments, and other
Figure 8.5
The SLC network configuration.


