Global Positioning System Reference
In-Depth Information
JPL
1
2
3
4
5
6
7
8
9
10
11
12
13
14
15
16
17
18
19
20
21
22
23
24
25
26
27
28
29
30
31
32
33
34
35
36
37
38
39
40
41
42
43
44
45
03/07/00
03
:00 - 04:00 UT
Global Ionospheric TEC Map
80
140
60
120
40
100
20
80
0
60
20
40
40
[19
20
60
10
80
Lin
—
0.0
——
No
PgE
0
3
6
9
12
15
18
21
24
local time (hours)
• GPS receiver
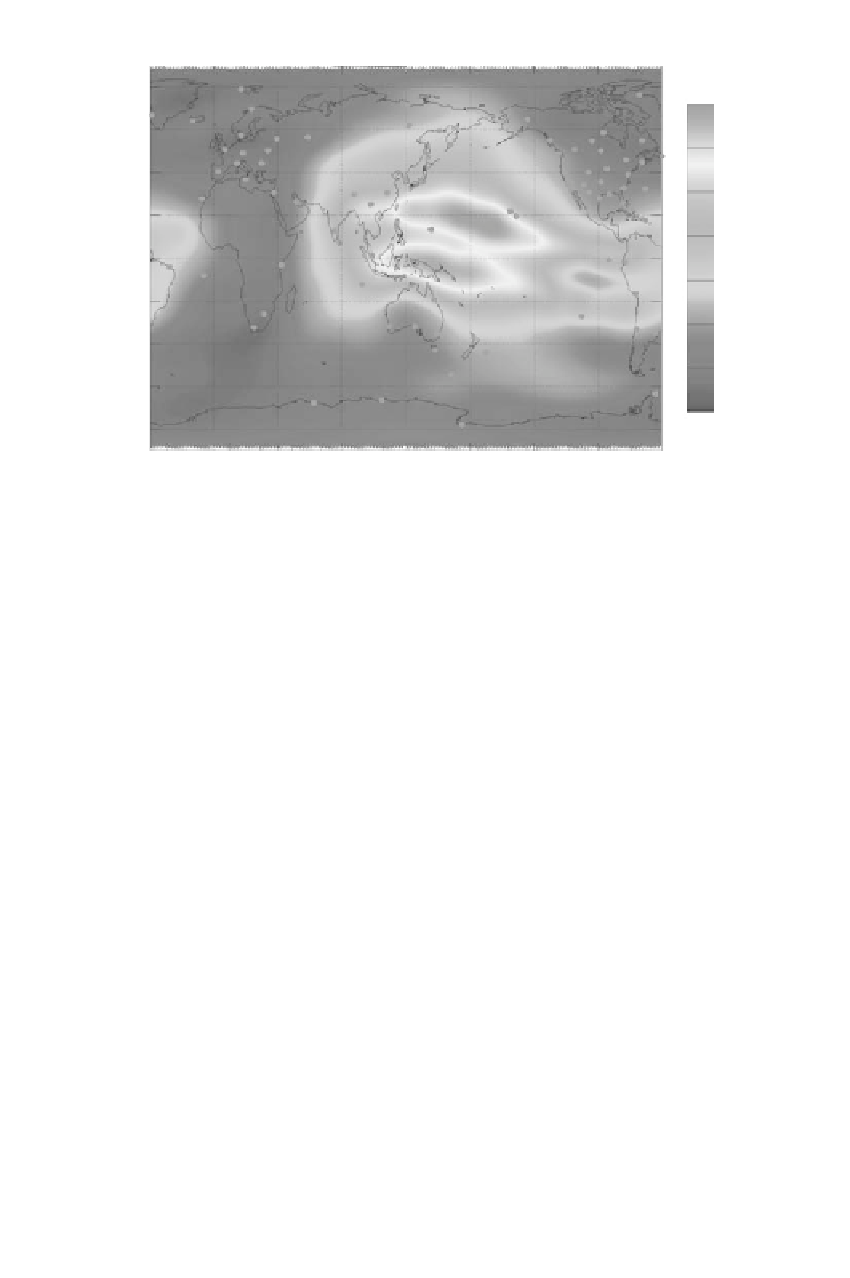
Figure 6.3
Snapshot of TEC.
(Courtesy of B. D. Wilson, JPL.)
(TEC) equals the number of free electrons in the column of unit area along which the
signal travels between receiver and satellite. Figure 6.3 shows a snapshot of the TEC.
The free electrons delay the pseudoranges and advance the carrier phases by equal
amounts. The size depends on the TEC and the carrier frequency; i.e., the ionosphere
is a dispersive medium. For GPS frequency the delays or advances can amount to the
tens of meters. Transmissions below 30 MHz are reflected. The texts by Hargreaves
(1992) and Davies (1990) are recommended for in-depth studies of the physics of the
ionosphere.
This GIM of the TEC on March 7, 2000, at 03 UT shows the typical global mor-
phology of the ionosphere when the Appleton (equatorial) anomaly is well developed.
There are two very strong peaks of ionization that lie on either side of the geomagnetic
equator. The peaks begin in the afternoon and stretch into the nighttime region. Also,
notice that the ionosphere is large since it is near solar maximum, although vertical
TECs can be larger than the 140 to 150 TECU on this day (1 TECU
[19
10
16
el/m
2
).
The peak of the ionosphere is typically in the equatorial region at 14:00 local time.
Each dot is the location of a GPS receiver that was used in the GIM model run. This
GIM's time resolution is 15 minutes, but images of the vertical TEC are typically
only made every hour for animations, which is why the image is labeled with the
time range 03-04 UT (B. D. Wilson, JPL, private communication).
The atmospheric parameters must be known with sufficient accuracy when apply-
ing respective corrections to observations. We typically use temperature, pressure,
and humidity at the receiver antenna, as well as the TEC. Mapping the spatial and
temporal distribution of these atmospheric parameters is also an area to which GPS
=