Global Positioning System Reference
In-Depth Information
1
2
3
4
5
6
7
8
9
10
11
12
13
14
15
16
17
18
19
20
21
22
23
24
25
26
27
28
29
30
31
32
33
34
35
36
37
38
39
40
41
42
43
44
45
the transformation between two epochs is accomplished by (McCarthy, 1996, p. 16)
=
I
t
0
)
x
(t
0
)
10
−
9
R
(
x
(t)
+
4
.
84813681
∗
Ω
) (t
−
(2.2)
Expression (2.2) propagates the position vector
x
from epoch
t
0
to epoch
t
within
the same reference frame. The NNR-NUVELL1A model can be applied to reference
station coordinates to update them as closely as possible to the actual epoch of
observations. For consistency, the reference frame for all fiducial points should be the
one implicit in the precise ephemeris used. The resulting coordinates would then refer
to the reference system of the precise ephemeris and the epoch of the observations.
Long-term station motions can readily be appreciated from Figures 2.2 and 2.3.
Because the definition of the frame ultimately involves stations that move with
the crust, one must take the time dependency of transformation parameters into
consideration when transforming between frames. For example, the parameters listed
in Table 2.2 refer to the IGS realization of the ITRF, which is expressed by the
designation IGS(ITRFxx). The epoch for these transformation parameters happens to
[16
Lin
—
0.9
——
Nor
PgE
NALL
THU1
TROM
KELY
KIRU
FAIR
METS
YELL
REYK
WHIT
ZWEN
CHUR
ONSA
MDVO
HERS
IRKT
PENT
[16
ALBH
ALGO
STJO
POL2
MADR
NLIB
T
AEJ
WEST
KIT3
USUD
ANKR
TSKB
LHAS
NOTO
BRMU
BAHR
TAI
S
MAS1
KOKB
MDO1
RCM5
CRO1
MKEA
GUAM
IISC
KWJ1
MOIN
K
OUR
GALA
MALI
BOGT
ASC1
FORT
SEY1
DGAR
COCO
AREQ
PAMA
BRAZ
EISL
HART
YAR1
TID2
LPGS
AUCK
PERT
SANT
HOB2
CHAT
KERG
MAC1
5 cm/yr
Heflin et al., 2002.3
CAS1
OHIG
DAV1
MCM4
http://sideshow.jpl.nasa.gov/mbh/series.html
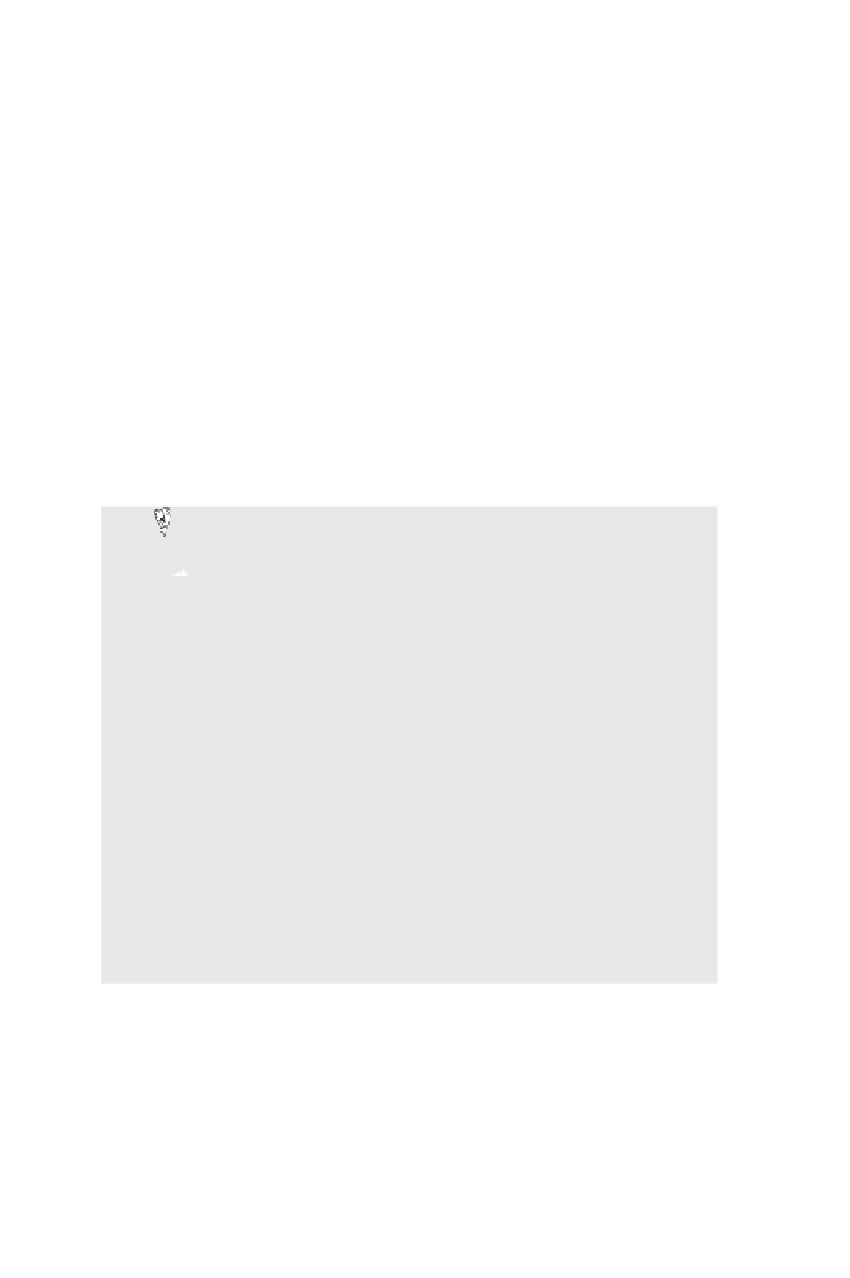
Figure 2.2 Observed motions of globally distributed stations.
Velocities for each site
were determined from more than eleven years of GPS data. Results are shown in the ITRF00
reference frame with no-net rotation of the crust. Rigid plate motion is clearly visible and
describes roughly 80% of the observed motion. The remaining 20% is nonrigid motion in plate
bo
undary zones associated with seismic and volcanic activity. The most visible plate boundary
zo
ne on the map is southern California. (Courtesy of Mike Heflin, JPL.)