Global Positioning System Reference
In-Depth Information
1
2
3
4
5
6
7
8
9
10
11
12
13
14
15
16
17
18
19
20
21
22
23
24
25
26
27
28
29
30
31
32
33
34
35
36
37
38
39
40
41
42
43
44
45
[13
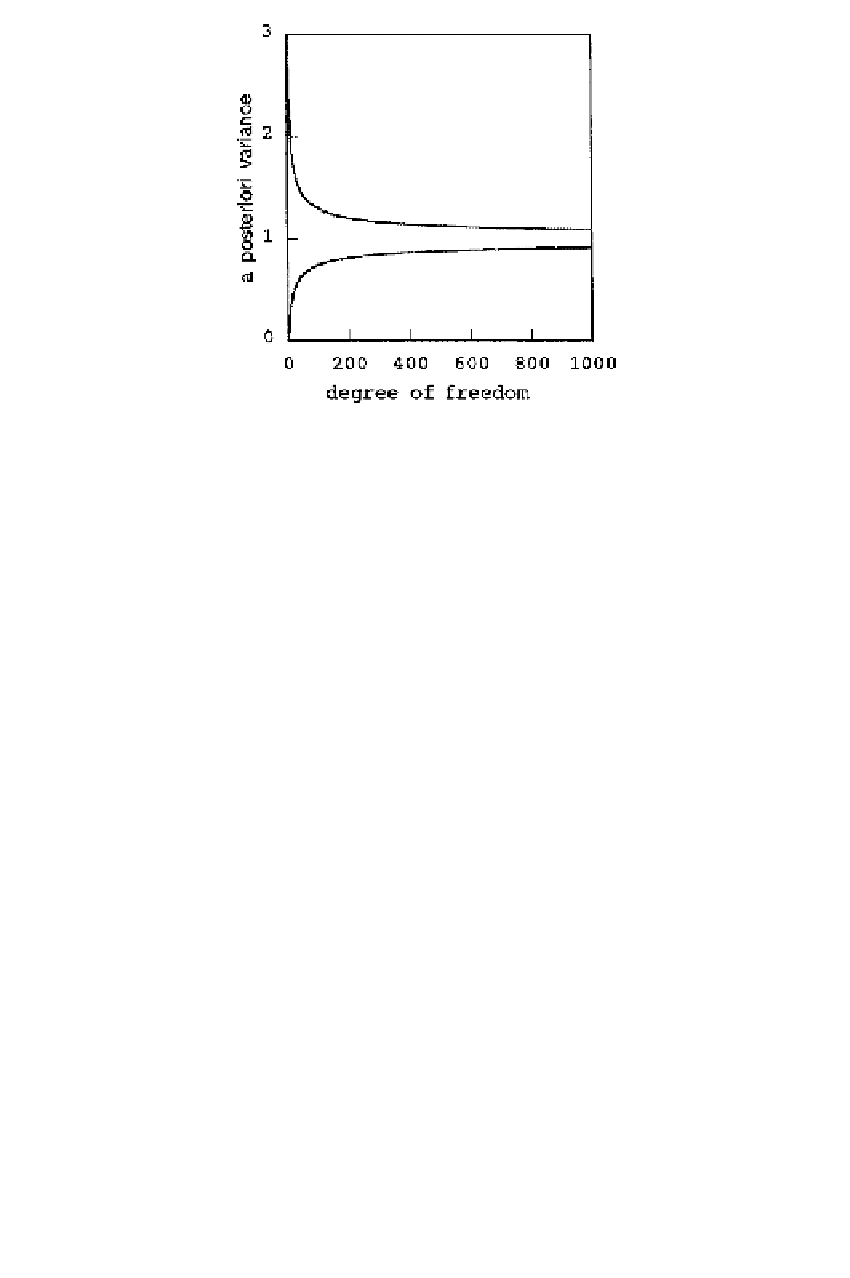
Fi
gure 4.3
Limits on the a posteriori variance of unit weight.
The figure refers to
α =
Lin
—
0.0
——
No
PgE
0
.
05.
The test statistics for testing groups of observations is based on
v
T
Pv
∗
and the
change
v
T
Pv
. According to Table 4.2 we have
∆
=
A
2
x
∗
+
2
T
T
A
2
x
∗
+
2
v
T
Pv
∆
(4.269)
z
3
Tz
3
=
[13
Th
e new random variable
z
3
is a function of observations
1
and
2
. Applying the
la
ws of propagation of mean and variance, one finds
A
2
E(
x
∗
)
E(
z
3
)
=
+
E(
2
)
=
A
2
x
−
A
2
x
=
o
(4.270)
T
−
1
Σ
z
3
=
(4.271)
N
o
,
0
T
−
1
2
z
3
∼
σ
(4.272)
Carrying out the orthonormal transformation yields a random vector whose compo-
nents are stochastically independent and normally distributed. By standardizing these
distributions and summing the squares of these random variables, it follows that
v
T
Pv
σ
z
3
Tz
3
σ
∆
n
2
=
∼ χ
(4.273)
2
0
2
0
has a chi-square distribution with
n
2
degrees of freedom, where
n
2
equals the number
of observations in the second group. The random variables (4.273) and (4.263) are
stochastically independent. To prove this, consider the new random variable
z
=