Biomedical Engineering Reference
In-Depth Information
(a)
Pre-injection
2 h
4 h
6 h
1.0
1.2
1.4
1.6
1.8
(b)
Pre-injection
2 h
4 h
6 h
1.0
1.2
1.4
1.6
1.8
(c)
1.8
CPMV-PEG-bombesin
CPMV-PEG
***
***
1.6
***
***
***
1.4
1.2
1.0
0.8
Pre-injection 1
2
3
4
5
6
Time after injection (h)
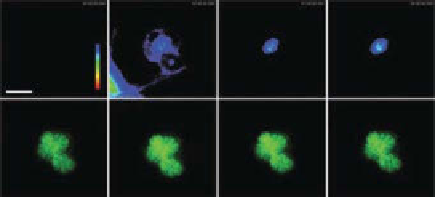
figure 14.5
intravital fluorescence images of CpMV uptake in pC-3 prostate tumor.
(a) representative images (
n
= 10) of Alexa Fluor 647-labeled CpMV-peG-bombesin (heat
map, above) uptake in the tumor (GFp signal, below) over time. Uptake is represented as
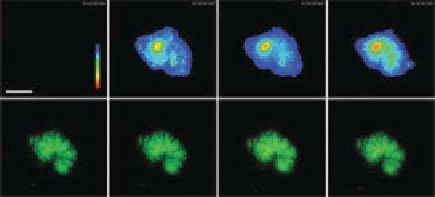
tumor/stroma ratio. Scale bar is 3 mm. (b) representative images (
n
= 10) of Alexa Fluor
647-labeled CpMV-peG (heat map, above) uptake in the tumor (GFp signal, below) over time.
Uptake is quantified by the tumor/stroma ratio. Scale bar is 3 mm. (c) plot of mean tumor/
stroma ratio comparing uptake of CpMV-peG-bombesin to CpMV-peG. Uptake of CpMV-
peG-bombesin was significantly higher at all time points after 2 h (
p
< 0.0001). (reprinted
with permission from ref. [69]. © elsevier.)
easier to distinguish. The ability to detect Mri contrast agents is extremely low, so
there is interest in coordinating multiple Gd
3+
ions to macromolecules in order to
enhance the relaxivity and hence sensitivity. VNps complexed with Mri contrast
agents offer two advantages: (1) due to their multivalency (see chapter 8), a large


Search WWH ::

Custom Search