Biomedical Engineering Reference
In-Depth Information
(a)
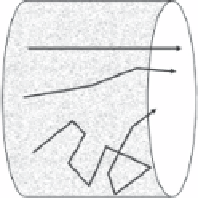
Ballistic photons
Snake photons
Diffuse component
(b)
1800
403
420
421
440
1600
11 × 11 map
1400
1200
X
2mm pixels
1000
800
X
600
X
400
X
200
0
600
800
1000 1200
Raman shift (cm
-1
)
1400
1600
1800
(c)
1
2
4
6
8
10
2
4
6
8
10
2
3
4
5
2468
10
246
810
6
7
2
4
6
8
10
2
4
6
8
10
8
9
10
11
246810
2
46810
1
figure 11.3
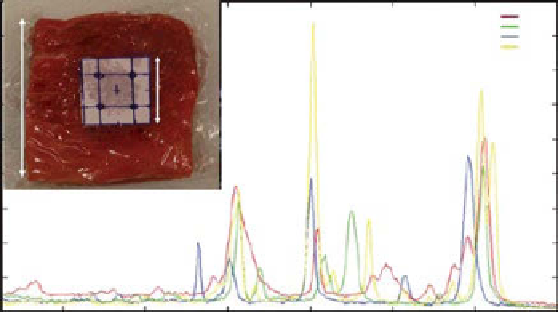
(a) Three main light components within turbid media. (b) SERS spectra of
cabot nanoparticles (nP) with different labels. The Xs signify the identity peaks used to mea-
sure the nP flavor signal in the SESoRS spectrum. inset image is a 20 × 50 × 50 mm porcine
block with grid used to align injection points of nP. (Reproduced with permission from Ref.
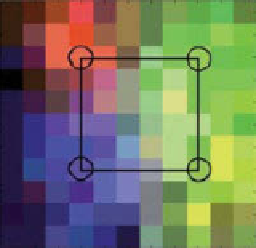
[25]. © Royal Society of chemistry.) (c) SERS mapping measured in a 11 × 11 grid, pixel size
2 mm. Left image shows all different signals plotted together with the injection points marked,
and right image shows the SERS signal of each labels. (Reproduced with permission from Ref.
[26]. © Royal Society of chemistry.) (
See insert for color representation of the figure.)
2
3
4
5
6
7
8
9
10
11


Search WWH ::

Custom Search