Biomedical Engineering Reference
In-Depth Information
(a)
(b)
α
F
bl
exp (-
t
/
τ
)
βF
T
× 10
4
10,000
I
free ligands in the plasma
2.5
I
free ligands in the tumor
9,000
8,000
2
7,000
6,000
1.5
5,000
4,000
3,000
1
2,000
1,000
f
(
x
) = 29,360 *exp(-
t
/1.4)
0.5
0
0.5
1
1.5
2
2.5
3
0
2
4
6
Time (h)
Time (h)
(c)
(d)
I
bound ligand-receptors
3.0
BT 474, cell line
Regression line, passing
though the origin
0.8
2.5
0.7
0.6
2.0
0.5
1.5
0.4
0.3
1.0
0.2
Data
0.1
0.5
Fitting line
0
0.0
-0.1
0
5
10
15
20
25
0
50
100
150
200
250
300
Time (h)
ELISA
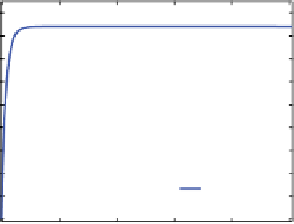
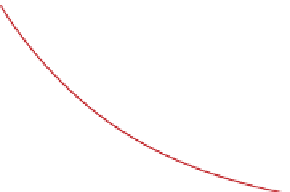
FIgure 9.13
Pharmacokinetic information obtained from imaging a mouse with high Her2
expression tumor (BT474) after injection of Her2-specific affibody conjugated to Dylight
750. (a) Intensity measured at contralateral site as a function of time and its exponential fitting
curve. (b) Concentration of free affibody probe inside the tumor. (c) NrA fitting. (d) Comparison
of NrA of five tumors with a high level of Her2 receptors (BT474 tumor) with the values
obtained by elISA after excision of the tumor. (With permission from ref. [60]. © Society of
Molecular Imaging.)
Figure 9.13 shows the results obtained from imaging a mouse with high Her2
expression tumor after injection of Her2-specific affibody conjugated with Dylight
750 fluorophores. The affibody probe binds to Her2 receptors and stays inside the
tumor but clears out from the blood circulation and normal tissues. Figure 9.13a
shows the fluorescence intensity, measured at the contralateral site as a function of
time and its single exponential fitting curve. Figure 9.13b presents the concentration
of free affibody probes in the tumor. The results shown in Figure 9.13b were obtained
from another mouse with the same type of tumor but after the injection of a nonspe-
cific Her affibody probe to monitor the pharmacokinetics of free dyes inside the
tumor. This figure shows the difference between the data obtained from the tumor
and contralateral sites and demonstrates the accumulation of free affibody probes
inside the tumor due to the leakiness of its vascularization. These results show that
the concentration of free affibody probes is almost constant inside the tumor and can
be modeled with the earliest measurement data when the binding of fluorescence


Search WWH ::

Custom Search