Biomedical Engineering Reference
In-Depth Information
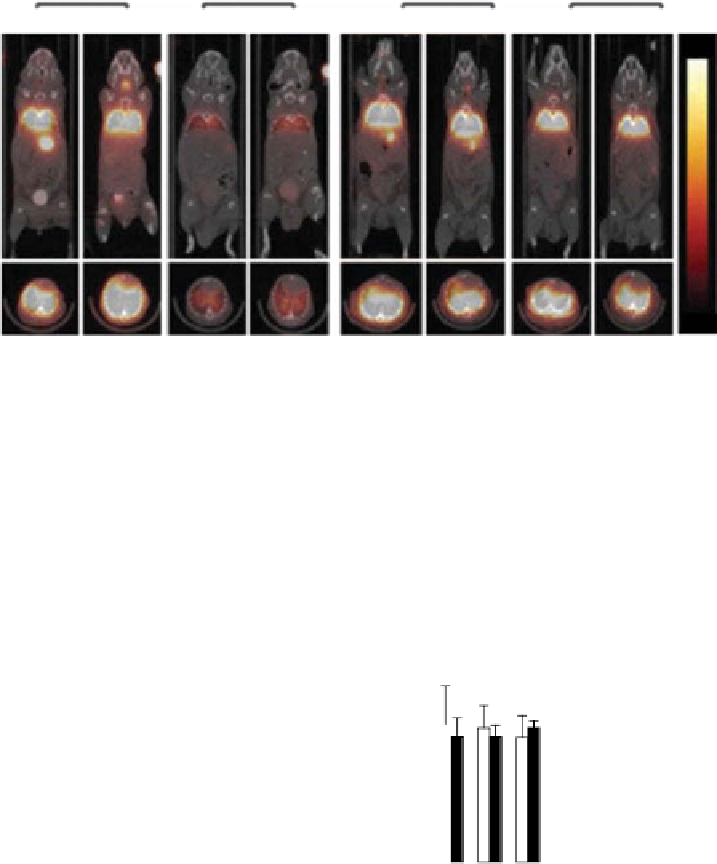
(a)
PMP
PNP
1 h
18 h
1 h
18 h
CPP -
CPP +
CPP -
CPP +
CPP -
CPP +
CPP -
CPP +
High
Low
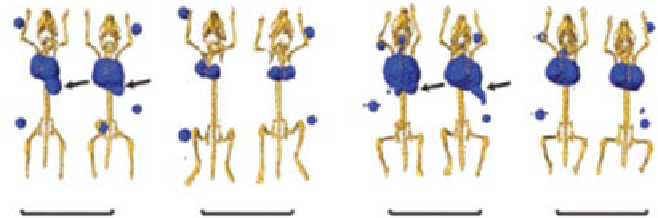
(b)
PMP
PNP
f
f
f
f
f
f
f
f
f
f
f
f
f
f
f
f
CPP -
CPP +
CPP -
CPP +
CPP -
CPP +
CPP -
CPP +
3 h
18 h
3 h
18 h
(c)
PMP
PNP
70
70
CPP -
CPP +
CPP -
CPP +
35
35
0
0
1 h
3 h 18 h
1 h
3 h 18 h
figuRe 7.3
micropeT/CT imaging of
76
br-labeled particles following intratracheal delivery.
(a) Representative midthoracic coronal (top) and transverse (bottom) slices of serial micropeT
and CT coregistered images obtained from mice at the indicated time following intratracheal
administration of
76
br-labeled particles. (b) Three-dimensional reconstructions of peT scan
activity merged with X-ray CT images that were signal adjusted to reveal the skeleton.
Arrows
indicate gastrointestinal tract activity. fiduciaries (f) used for coregistration are included. (c) The
standardized uptake values (SUVs) of the peT activity within the lung region from images as
in (a), shown as the mean ± SD of 3-4 mice per particle type. (Reprinted with permission from
Ref. [130]. © American Chemical Society.)


Search WWH ::

Custom Search