Biomedical Engineering Reference
In-Depth Information
(a)
(b)
10 min
30 min
1h
1h
30 min
3h
5h
(c)
(d)
10
1.00
8
0.80
6
0.60
4
0.40
15 nm
2
0.20
0
0.00
ICP-MS
Radioactivity
(
γ
count)
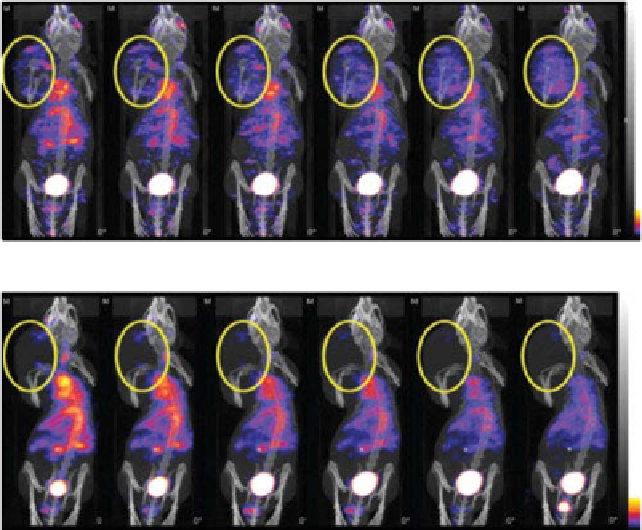
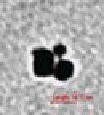
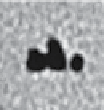
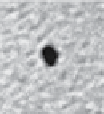
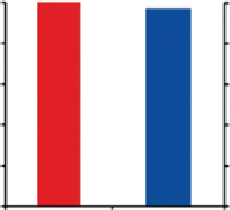
figuRe 7.2
(a) Small animal SpeCT/CT of
125
I-cRp-AuNps and (b) cold-form-blocked
125
I-cRgD-AuNps in nude mice bearing U87mg tumors xenografts after injection through tail
vein. The SpeCT/CT studies were performed serially from 0 to 5 h after injection of 11.1 mbq
radiolabeled AuNps. Yellow circles indicates tumor region. (c) Tem images of gold nanopar-
ticles obtained from urine samples. (d) biodistribution comparison of cRpAuNps (inductively
coupled plasma mass spectrometry [ICp-mS]) and iodine-125 (γ count). Data obtained from
tumor 1 h after injection. %ID = injection dose. (With permission from Ref. [87]. © Wiley.)
(
See insert for color representation of the figure.)

Search WWH ::

Custom Search