Biomedical Engineering Reference
In-Depth Information
the bottom images, OAT revealed not only the structure of large vessels but also
small blood vessels just few hours after Peg-HAuNs administration. Brain blood
vessels in the superficial cortex as small as approximately 100 µm in diameter could
be clearly seen. In order to confirm the distribution of Peg-HAuNs in the brain, the
blood vessels were stained with anti-cD31 antibody, while the scattering signal of
the gold nanoparticles was detected under a dark field. As shown in figure 5.17, the
HAuNs were located on the luminal side of the blood vessels 2 h after intravenous
injection. In brain capillaries, most of the nanoparticles colocalized or stayed adja-
cent to the brain capillary endothelial cells.An interesting and promising example of
novel contrast agents for OAT is a nanoconstruct called gold nanobeacons. gold
nanobeacons are lipid- or polymer-encapsulated colloidal particles incorporating
tiny gold nanoparticles (2-4 nm) with an overall size in three tunable sizes (90, 150,
and 390 nm). several publications from the Lanza group [29, 156-158] summarized
current data for the development of a family of colloidal gNBs for nanomedicine and
OA applications. The latter was successfully used for the detection of lymph nodes
and microvessels in an angiogenesis model [158]. As stated earlier, angiogenesis is
an essential microanatomical component of many tumors. Angiogenesis is also an
indicator of cardiovascular progression that may be effective as a quantitative marker
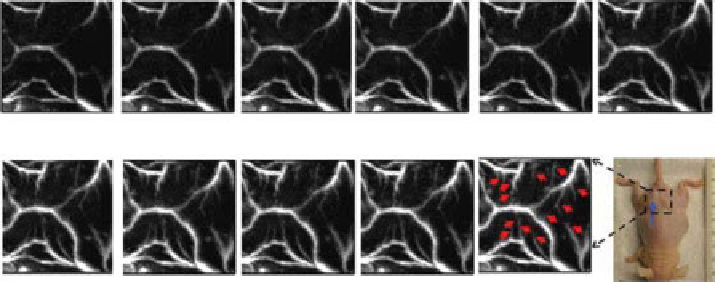
of cardiovascular plaque progression or response to therapy [158-160]. figure 5.18
illustrates the marked enhancement of angiogenic vessel imaging with PA contrast
over time. Individual microvessels observed prior to treatment were significantly
enhanced with αvβ3 nanobeacon. These developing neovessels were probably too
immature and incomplete to support the blood flow. similar images in the saline con-
trol animals showed no change in vascular anatomy over the same time course.
Baseline
15 min
45 min
1.5 h
2.0 h
2.5 h
3.0 h
3.5 h
4.0 h
4.5 h
5.0 h
figure 5.18
The nude mouse was imaged optoacoustically 8-20 days after matrigel™
0.75 ml aliquot subcutaneous implantation. control image is baseline. After the control image
was taken, targeted gold nanobeacons (αvβ3-gNB-m) were injected into the tail vein. OA
images were acquired with an interval of approximately 0.5 up to 5 h. gray arrows point to the
angiogenic sprout (not visible in baseline). for all OA images,
λ
= 767 nm, and scale bar = 5 mm.
Digital photograph of a mouse implanted with matrigel™ plug. (Reproduced with permission
from Ref. [158]. © John Wiley and sons.)
Search WWH ::

Custom Search