Chemistry Reference
In-Depth Information
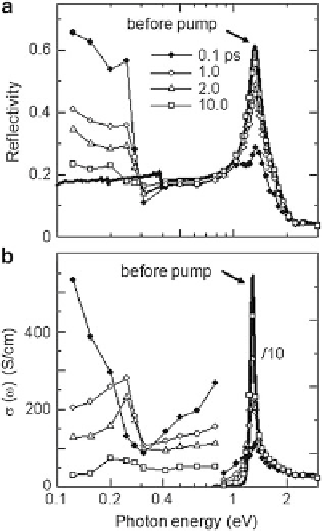
Fig. 5.5 (a) Polarized
reflectivity spectra in
[Ni(chxn)
2
Br]Br
2
before and
at the delay time
t
d
after the
photoexcitation at room
temperature. The excitation
energy is 1.55 eV and the
excitation density
x
ph
is 0.5
photon/Ni site. Polarizations
of both the pump and probe
lights are parallel to the chain
axis
b
.(b) Optical
conductivity
s
(
o
) spectra
obtained by the
Kramers-Kronig analyses of
the reflectivity data in (a)
excitation of
x
ph
<
0.012, a midgap absorption is observed at 0.4-0.5 eV in the
s
spectrum as depicted in Fig.
5.6
. With increase of
x
ph
, the low-energy part of
s
below 0.2 eV remarkably grows, and for
x
ph
>
0.1, the optical gap seems to
disappear.
To investigate the time evolution of the photoinduced I-M transition (Mott
transition), it is useful to examine the transfer of the spectral weight from the CT-
gap region to the inner-gap one. The spectral weight can be quantitatively analyzed
in terms of the effective number of electrons
N
eff
(
o
) defined as follows [
50
,
54
].
Z
o
2
m
0
pe
2
N
sðo
0
Þ
4
do
0
N
eff
ðoÞ¼
(5.1)
p
0
Here,
m
0
is the free electron mass and
N
the number of Ni atoms per unit volume.
N
eff
(
.
Since the lower energy bound of the measured photoinduced signals is 0.12 eV, the
photoinduced change in
N
eff
(
o
) is the measure for the kinetic energy of electrons on an energy scale of
ho
D
N
eff
) was calculated by using
s
from 0.12 eV to
ho
.
The results for various
x
ph
at
t
d
¼
D
N
eff
(
o
0.1 ps are presented in Fig.
5.7
.
)
ho
monotonically increases with
up to 1 eV, reflecting the accumulation of the
spectral weight below 1 eV. Then, it abruptly drops almost to zero at 1.3 eV due to
the bleaching around the CT band, signaling that the spectral weight of the CT-gap
transition is transferred to the inner-gap region by the photocarrier doping. The
values of
D
N
eff
above 1.5 eV for
x
ph
¼
0.12 and
x
ph
¼
0.5 are negative as seen in

Search WWH ::

Custom Search