Chemistry Reference
In-Depth Information
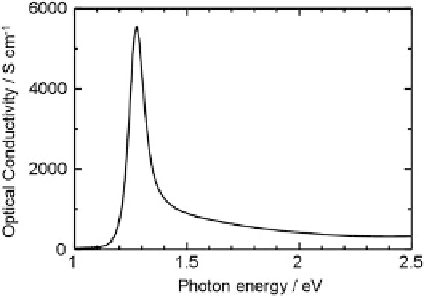
Fig. 3.4 Optical conductivity
spectrum of [Ni(chxn)
2
Br]
Br
2
. Inset shows proposed
band structure determined by
XPS and optical conductivity
spectra
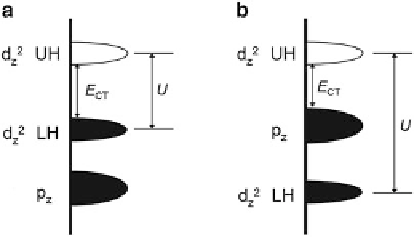
Fig. 3.5 Band structures of
(a) MH and (b) CT insulators
Fig. 3.6 Luminescence
spectra of [Ni(chxn)
2
Br]Br
2
Figure
3.6
shows the temperature dependence of luminescence spectra with
excitation energy
E
ex
¼
1.96 eV. Large and small broad peaks were observed at
1.3 and 1.4 eV, respectively. Intense bands in the optical conductivity spectrum at
1.3 eV have been assigned to LMCT transitions (Br
,Ni
3+
Br
0
,Ni
2+
)[
19
].
Therefore, the luminescence peak observed at 1.3 eV was attributed to the relaxa-
tion of an LMCT exciton state (Br
0
,Ni
2+
!
Br
-
,Ni
3+
). This luminescence
exhibited little or no Stokes shift, showing that the LMCT exciton does not easily
!

Search WWH ::

Custom Search