Chemistry Reference
In-Depth Information
a
b
Pt-Br-Pt-II
Pt-Br-Pd
10
10
1
1
0.1
E
det
=1.19eV
t
=220psec
E
det
=1.52eV
t
=390psec
0.1
0.01
0
0.4
0.6
0
0.5
1
1.5
0.2
Time (nsec)
Time (ns ec )
400
400
300
300
200
200
100
100
0
0
0.8
1.0
1.2
1.4
1.2 1.4 1.6 1.8
Photon energy (eV)
Photon energy (eV)
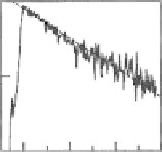
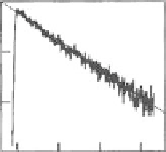
Fig. 2.13 Photoluminescence spectra (
solid lines
) and photoluminescence decay time
t
(
circles
)
at 10 K for the excitation energy of 3.2 eV in (a) Pt-Br-Pt-II and (b) Pt-Br-Pd. Both the excitation
lights (
E
ex
) and the emission lights (
E
) are polarized parallel to the
b
axis. Insets show the time
characteristics of photoluminescence for the detection energies of 1.19 eV in Pt-Br-Pt-II and
1.52 eV in Pt-Br-Pd.
Broken lines
show single exponential decays. (Reprinted figure from [
52
])
magnitude smaller than the radiative life time
t
r
of STEs (4-6 ns) [
20
,
48
], which
was estimated from the oscillator strength of the CT-exciton transition in typical Pt
compounds. This indicated that annihilations of STEs were dominated by
nonradiative processes.
Figure
2.14
showed the temperature dependence of the decay time
t
of PL in
Pt-Br-Pt-II and Pt-Br-Pd, which was well reproduced by using the following
formula as shown by the broken lines in Fig.
2.14
.
1
t ¼ t
0
1
þ t
a
1
exp
ð
D=kT
Þ
(2.1)
The used parameter values were
t
0
¼
225 ps,
t
a
¼
115 ps, and
D ¼
9.5 meV in
Pt-Br-Pt-II, and
t
0
¼
385 ps,
t
a
¼
38 ps, and
D ¼
34 meV in Pt-Br-Pd. The
smaller values of
t
0
) in Pt-Br-Pt-II compared to Pt-Br-Pd was
considered due to the conversion from STEs to soliton pairs.
The theoretical studies based upon the 1D extended Peierls-Hubbard model
provided detailed potential energy surfaces of the excited states for homometal
CDW compounds, which were detailed in [
22
,
23
,
51
] and also in Chap.
8
. The inset
of Fig.
2.14
showed the cross section of the first and the second lowest potential
surfaces as a function of intersoliton distance
l
0
. The higher potential surface
t
(or
D
and


Search WWH ::

Custom Search