Chemistry Reference
In-Depth Information
PESR
Pt-Br-Pt-II
0.08
E
CT
15
77 K
E
// b
E
ex
// b
0.06
10
0.04
5
0.02
a
0
0
10
Pt-Br-Pd
E
CT
a
1
PESR
77 K
E
// b
E
ex
// b
2
5
1
b
0
1.5
2.0
2.5
3.0
3.5
4.0
Photon energy (eV)
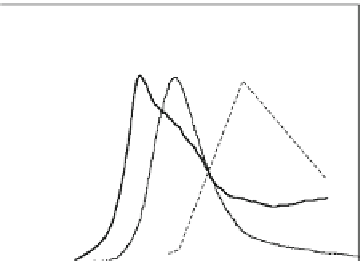
Fig. 2.10 Excitation profiles for the intensities of the PA bands (
open marks
), the PESR (
solid
squares
), and the luminescence (
thick solid lines
) at 77 K in (a) Pt-Br-Pt-II and (b) Pt-Br-Pd.
Thin solid lines
show the imaginary part of the dielectric constants
e
2
. (Reprinted figure from [
52
])
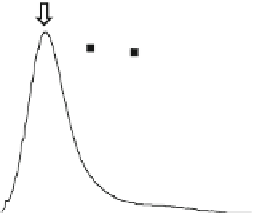
shown by solid squares in Fig.
2.10b
. The PESR signals were observed only by the
excitations above 2.7 eV. Such a behavior is in agreement with the excitation profile
of the PA band a
1
, so that a
1
is associated with a spin (
S ¼
1/2).
Since these PA bands were observed in the gap region, it is natural to consider
that they are attributable to spin-solitons (
S
0
), charged-solitons (
S
þ
,
S
), or polarons
(
P
þ
,
P
)[
10
,
16
,
21
]. Figure
2.11
shows the localized energy levels of spin-solitons
(
S
0
), charged-solitons (
S
and
S
þ
), and polarons (
P
and
P
þ
) in the case that the
transfer energy
t
between the neighboring metal ions is equal to zero [
21
]. From this
simplified picture, we can understand that
S
0
,
P
þ
, and
P
have spin
S ¼
1/2, and
S
þ
and
S
have no spin, while
S
þ
,
S
,
P
þ
, and
P
have a charge. The more realistic
electronic structures of these gap states with a finite
t
are presented schematically in
Fig.
2.12
. Several groups reported theoretical absorption spectra of the gap states
obtained based upon the 1D extended Peierls-Hubbard model [
27
,
33
-
35
,
47
].
Their spectral features are essentially the same; two absorption bands arise for a
polaron, and one midgap band arises for either a spin- or charged-soliton.


Search WWH ::

Custom Search