Chemistry Reference
In-Depth Information
a
B
CP
B
2.5
CP
CDW
2
A
A
1.5
CDW
CDW
CP
0
0.2
0.4
0.6
0.8
P(GPa)
b
(i) P=0.25GPa(A)
(ii) P=0.50GPa(B)
Before
irradiation
h
ν
= 2.71
eV
h
ν
= 2.41 eV
After
irradiation
Fig. 11.7 (a) Pressure dependence of
E
gap
. The insets show the schematic energy potential curves.
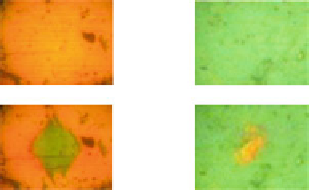
(b) Photographic images at the points (i)
A
and (ii)
B
before and after photoexcitation. Polarization
of the excitation light is parallel to the chain axis
c
Fig. 11.8 Pressure
dependence of the
magnitudes of decreases of
sample size along the chain
axis
c
in
[(C
2
H
5
)
2
NH
2
]
4
[Pt
2
(pop)
4
I] in
the pressure-applying run
10
5
0
0
1
2
3
P
c
P(GPa)
from the meta-stable state to the ground state at the points
A
and
B
were
investigated. Figure
11.7b
(i) represents the images of the sample at
A
before and
after the photoexcitation with 2.41-eV light for 8 ms, which is obtained from a CW
Ar-ion laser. As can be seen, the crystal exhibits a permanent color change from
brown to green in the irradiated region. The Raman signal in the irradiated region is
almost identical to that of the low-pressure phase, indicating that the PIPT from
CDW to CP state occurs.


Search WWH ::

Custom Search