Chemistry Reference
In-Depth Information
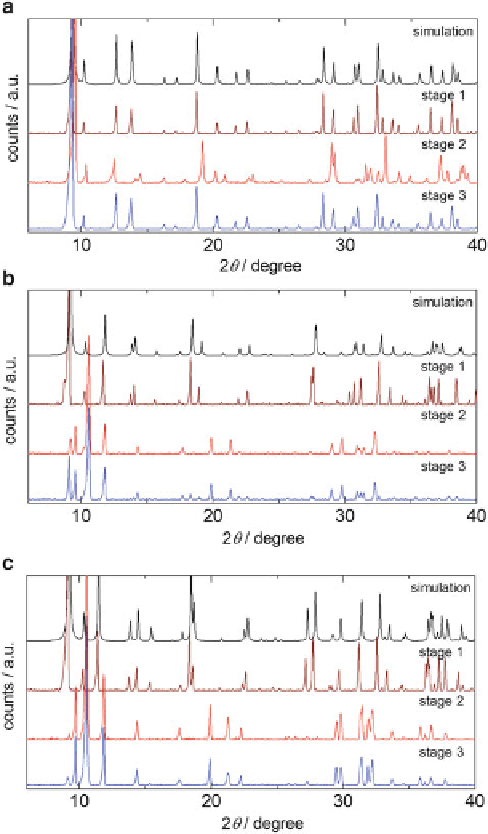
Fig. 10.15 XRD patterns of (a)K
2
(NC
3
N)[Pt
2
(pop)
4
I]
4H
2
O, (b)K
2
(NC
5
N)[Pt
2
(pop)
4
I]
4H
2
O,
(c)K
2
(NC
2
OC
2
N)[Pt
2
(pop)
4
I]
4H
2
O simulated by the crystal structure (
black
), measured at stage
1(
brown
), stage 2 (
red
) and stage 3 (
blue
)
s
RT
by dehydration and rehydration depends on the complex. In
the case of the complexes (B
2+
The change of
NC
3
N
2+
, Me-NC
3
N
2+
, Cl-NC
3
N
2+
,
¼
trans
-
NC
4
N
2+
),
s
RT
at stage 2 (dehydrated state) were 10-100 times larger than that at
stage 1 (initial states). Contrastingly, in the case of the complexes (B
2+
¼ cis
-
NC
4
N
2+
,NC
5
N
2+
),
s
RT
at stage 2 were 0.25 and 0.04 times larger than those at
stage 1, respectively. These decrease of
s
RT
may be due to the partial degradation of
Search WWH ::

Custom Search