Chemistry Reference
In-Depth Information
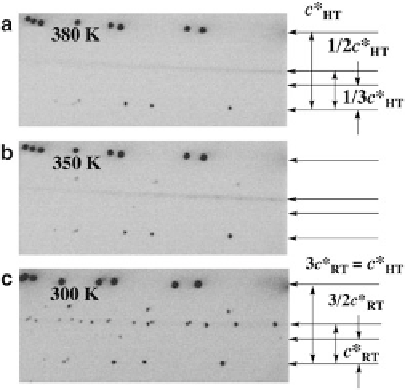
Fig. 9.23 Portions of X-ray
diffraction photographs of
[Pt
2
(
n
-PrCS
2
)
4
I]
1
(3)[
34
].
The chain axis
c
is vertical.
(a) At 380 K in HT phase.
(b) At 350 K in RT phase.
(c) At 300 K in RT phase
corresponding to a -Pt-Pt-I- period. The crystal structure of 3 in the RT phase,
including the weak intensities of
l
1/3, has already shown in Fig.
9.5
[
34
].
The origin of threefold periodic structure results from both the twist of the adjacent
diplatinum units and the difference in the conformation of the dithiobutanato
ligands. On the other hand, the Bragg spots of
1/2 observed in the typical
semiconducting region change to diffuse streaks around 350 K in the RT phase,
in which the electric conductivity is deviated from the typical semiconducting
behavior. The Bragg spots observed at
l þ
l þ
1/2 correspond to the three-dimensional
valence ordering, that is, the valence-localized state corresponding to ACP or CDW
state. As described above, the diffuse scattering with the twofold repetition length
observed for 2 is ascribed to the dynamical valence-ordering with the twofold
periodicity corresponding to CDW state existing in an extremely short time scale
[
32
,
73
]. Similarly, the diffuse scattering observed for 3 above 320 K can therefore be
attributed to the valence-fluctuating state corresponding to a dynamic ACP or CDW
state. The sixfold periodic structure including the twofold periodic valence ordering
in the RT phase, in addition to the threefold periodic structure arising from the
structural difference between the diplatinum units, has not been determined yet,
since reflections indexed as
l
1/6 are entirely absent. As shown in Fig.
9.23
,the
intensities of reflections of
l
1/3 decrease above 300 K and disappear at 380 K,
indicating that the lattice periodicity changes from the threefold of a -Pt-Pt-I- period
in the RT phase to onefold in HT phase in agreement with the crystal structure in the
HT phase.
9.2.6.3
[Pt
2
(n-BuCS
2
)
4
I]
1
(4)
In the X-ray oscillation photographs taken in the RT phase of 4 (Fig.
9.24a, b
), the
weak Bragg spots have appeared at the reciprocal positions indexed as
l
1/3
Search WWH ::

Custom Search