Chemistry Reference
In-Depth Information
CDW
Mott Insulator
CDW
1.4
1.3
1.2
1.1
1
0.9
0.8
0.7
0.6
0
10
20
30
40
50
60
70
80
90
100
Site Number
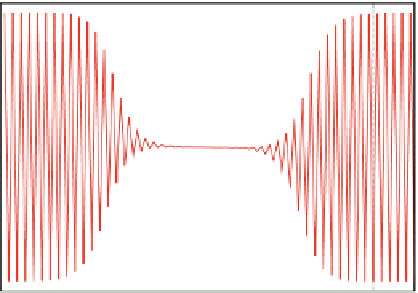
Fig. 8.30 Electron density in the presence of a Mott-insulator domain in the CDW background
This result tells us that the actual Pd compound is really located near the phase
boundary whichever the parameter combination is.
We next introduce the result that demonstrates how the phase conversion occurs.
The calculation was performed in almost the same manner as that was done in the
soliton formation within the CDW phase, except for the assumed trajectory as in
Fig.
8.28
. Note that the formed domain in the central region loses the halogen lattice
dimerization instead of the dimerization-phase inversion in the soliton case. In
Fig.
8.29
, we show the adiabatic potential curves calculated by the DMRG method,
with Fig.
8.29a, b
corresponding to the point A and C, respectively. The
calculations indicate that the results are rather sensitive to the selection of the
points. In fact, in Fig.
8.29a
, the curve in the first singlet excited state has no energy
barrier in its relaxational path from the photoexcitation down to the Mott-Hubbard-
insulator domain, while that in Fig.
8.29b
shows a slight energy barrier, meaning
less efficient domain formation process. As for the point B, it gives a result similar
to the point A. The actual PdBr compound shows a linear behavior in the
photoinducing process of the Mott-Hubbard-insulator state [
48
]. This means that
even one absorbed photon creates a substantial size of domain, and therefore the
result in Fig.
8.29a
is consistent with the observation.
In the rest of this subsection, we briefly mention the electric charges of the
domain wall. If the system is exactly on the phase boundary, the domain feels no
potential energy that increases with the domain size otherwise. In those cases, not
the domain size but the positions of the domain walls are appropriate as the degrees
of freedom of the system. In other words, the two domain walls are expected to
move freely to each other, and allow the possibility to be detected separately. In
particular, the charges are intriguing, because they are expected to become frac-
tional. In Fig.
8.30
, we show the distribution of the electron density, in which the
central region corresponds to the Mott-Hubbard-insulator domain (K. Iwano,
unpublished). Note that we here use the extended Hubbard model and the HF
method to calculate the density in a large system, because we assume that the effect


Search WWH ::

Custom Search