Chemistry Reference
In-Depth Information
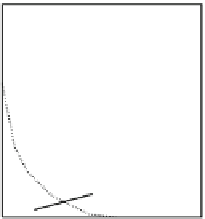
Fig. 8.27 A-C in the phase
diagram are candidates for the
realistic parameter
combinations and the target
points in the calculations.
Reprinted from Iwano [
49
].
Copyright (2004) by the
American Physical Society
0.8
0.6
CDW
0.4
C
B
0.2
MH Insulator
A
0
0
0.2
0.4
0.6
0.8
2
α /
K (eV)
bðQ
lþ
1
Q
l
Þ
. This is nothing but the transfer modulation due to the bond-length
change as
intensively discussed in the Su-Schrieffer-Heeger model
for
polyacetylene [
7
].
The calculated results are summarized in Fig.
8.26b
with a level scheme in the
hole picture, Fig.
8.26a
[
9
]. Regarding the parameter values, the readers are
recommended to see [
9
]. Although all the values are not determined uniquely as
will be shown in the next subsection, this successful reproduction of the observed
peak energies supports the above-mentioned idea, namely, the PdBr compound as a
metastable Mott-Hubbard insulator state.
8.4.3 Photoconverting CDW to a Mott Insulator
Following the previous subsection, we continue the discussion of the metastable
Mott-Hubbard state of the Pd compound. Since we have already discussed from
both the experimental and theoretical sides that it is very likely to exist, the next
question is how we can detect such a state in the pure PdBr compound. To answer
this question, Matsuzaki et al. performed the pump-probe experiment that shined
the light to this compound in the CDW ground state and obtained a signal that really
indicated the Mott-Hubbard state [
48
]. Here, we do not repeat this successful story
and only describe the theoretical aspect.
In Fig.
8.27
, we show a phase diagram that was obtained based on the calculation
in the previous subsection [
49
]. As was mentioned previously, there is a factor
undermined there. It was the combination of the two types of e-l couplings, namely,
(
a
,
b
). In this diagram, we again make them have the dimension of energy, and use
2
2
a
=K
as the coordinates. The solid line in this figure is the phase boundary
between the two phases that we have been discussing, while the dotted line
corresponds to the parameter combinations that give the observed CDW peak
energy, 0.7 eV, in the Pd compound. The form of these curves understood by the
expression of an effective total e-l interaction,
=K
and
b
a a þ½
2
t
dp
=ðe
p
e
d
Þb
. What is


Search WWH ::

Custom Search