Chemistry Reference
In-Depth Information
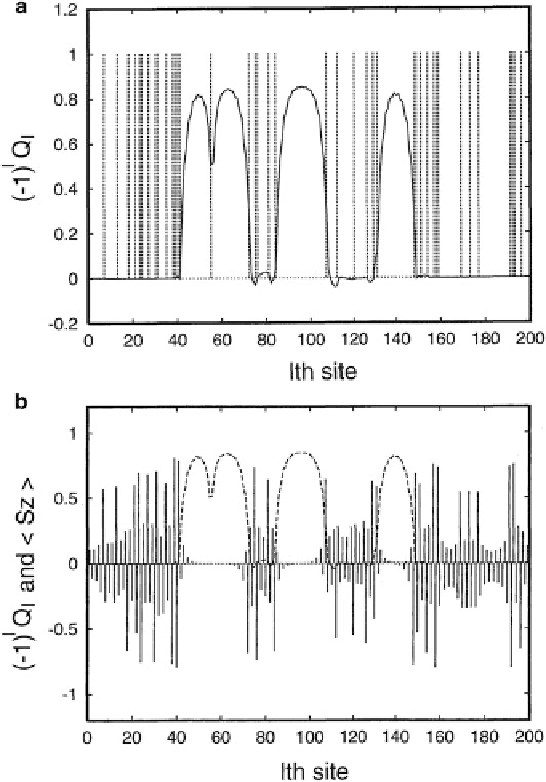
Fig. 8.24 Result of a simulation for the 20%-Ni concentration case. (a) Alternate component
of the lattice (amplitude of dimerization) with the Ni-site positions depicted by the
vertical lines
.
(b) Spin density distribution (
solid line
) also with the alternate lattice component (
dotted line
).
Reprinted from Iwano [
46
]
susceptibility, suggesting that the substantial region of the system is converted into
the Mott insulator even at this small mixing rate. Similarly, the other two
observables also suggest the formation of the Mott-insulator state at lower Ni
concentration than we expect from the linear behavior. More specifically, the IR
signal detects the charge densities at the metal sites, while the Raman signal detects
the dimerization of the halogen sublattice, both being indispensable in identifying
the CDW.
Search WWH ::

Custom Search